
The recent bout of selling in the U.S. markets prompted investors to rethink their longer-term strategies. But our interpretation of this rotation was consistent with moderate price rotation that we've seen nearly every 20 to 30 days, on average, for almost the past year or longer. The markets need to really break away from this upward price trend in order to initiate some new correction or downward price phase. Otherwise, we continue to see moderate price rotation in an upward sloping market.
The economic data and investor expectations may change at some point in the future, but we have not seen the S&P 500, NASDAQ Composite or Dow Jones Industrial Average break away from any major trending recently. One could argue that the Dow Jones, the big blue-chip index, and the Russell 2000, the mid-cap index, have actually broken away from upward trending. But one could also argue that investor capital has shifted over the past 6+ months away from blue-chips and mid-caps, and more towards technology, health care, biotech, home builders and real estate. This shift in how capital is being deployed may account for the somewhat sideways price trend in the Dow Jones and Russell 2000 recently.
S&P Riding 50 DMA Higher
This daily ES S&P 500 E-Mini Futures chart highlights the continued upward price trend and the continued rebounding off the 20- and 50-day moving averages over the past 8+ months. I've drawn MAGENTA arcs below each time the S&P has pulled back to the 50 DMA and initiated a strong rebound/recovery attempt.
Until this cycle of moderate rotation, then a strong rebound in price trending is broken and we see some decidedly downward price trending, traders should expect more of this type of pattern in the future. Of course, the Federal Reserve's continued support and buying of assets assist in supporting this type of trending higher. Traders look at these pullbacks as very strong buying opportunities for instant profits in many cases.
Let's take a look at some current price charts to see how this trend is setting up right now.

The NASDAQ Shows More Bullish Bias Than The S&P 500
The NASDAQ has been ripping higher over the past 6+ months. This is mostly because of how the U.S. economy has transitioned into a remote/work-from-home economy and how technology services, health care, biotech, real estate and home building sectors have been performing over the past 6+ months. The NASDAQ is uniquely positioned to take advantage of the current shift in how the economy is performing and where consumers/traders are taking advantage of trends.
We are seeing the NASDAQ trending within a very defined and tightening price channel, highlighted by the CYAN trend lines. Recently, near the end of August and into early September, we saw the NASDAQ rally above the upper CYAN trendline and recently fall back into the trendline range. As the NASDAQ nears the apex level of this very broad pennant/flag formation, traders should expect increased volatility in price and the potential for some very big price swings in the near future.
The current bottom in price is setting up near the 20 DMA, which has happened many times over the past 6+ months. It would take a much deeper price pullback to reach the 50 DMA average (the LIGHT GREEN line). We don't believe that is likely as we move into Q3:2021 earnings over the next few weeks and into the Christmas rally phase of the markets.

Changing Markets Push Global Investors Into U.S. Assets
Certainly, we will agree the markets have extended to what some consider extreme highs and are showing signs of extreme overbought conditions. But, we also have to consider how the markets have changed over the past 24 months. COVID pushed the markets away from a more traditional brick-and-mortar type of economy and shoved us into a new type of economic process. Where services, technology, essential supplies/components and rampant inflation are changing how consumers spend their time/money.
The stock market, and the continued strength of the U.S. dollar, has continued to attract capital from all corners of the world. The U.S. stock market is more than 8x more capitalized than any other foreign market exchange. Take a look at this graphic from Statista.com highlighting the incredible amount of capital deployed in the U.S. stock market compared with other foreign markets.
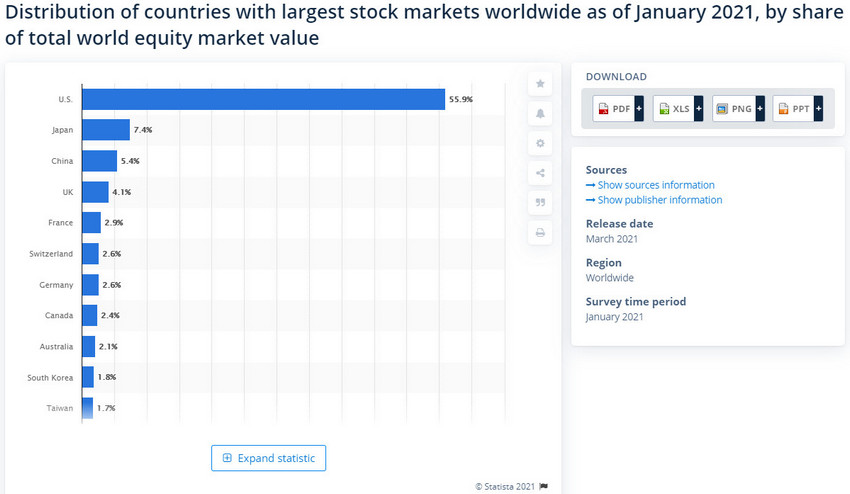
(Source: https://www.statista.com/statistics/710680/global-stock-markets-by-country/)
It seems the world is running on U.S. fuel related to the strength of the U.S. economy and the support of the Federal Reserve. While the U.S. dollar continues to stay above $88~$89, it is very likely that the upward trending in the U.S. stock market will continue. Traders simply can't move away from the U.S. market and miss the opportunities it creates.
Get ready for more trending as we shift into Q4:2021 and the start of the 2021 Christmas rally phase in the U.S. stock markets.