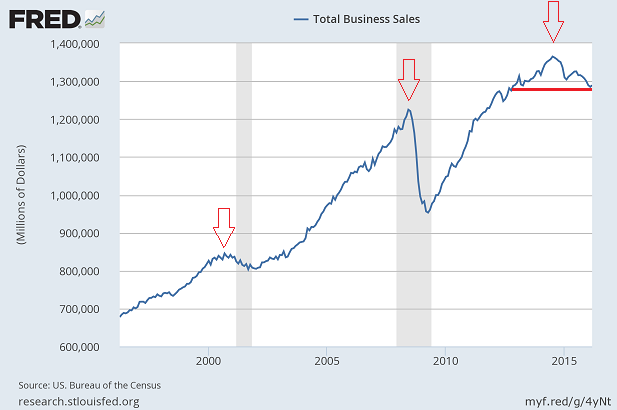
Companies primarily generate revenue by selling goods and services. When their sales peak, and subsequently decline, stock prices tend to move lower. Will this time be different?
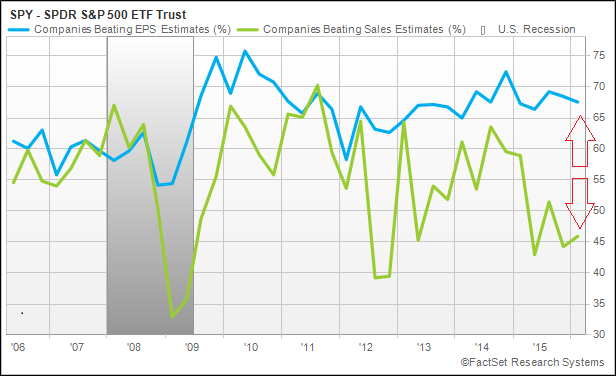
Granted, public corporations represented by the S&P 500 SPDR Trust (NYSE:SPY) have been able to manipulate perceptions of profitability by surpassing exceptionally low earnings estimates. Yet they’ve been far less successful at beating depressed sales expectations. It follows that the chasm between the two continues to widen.
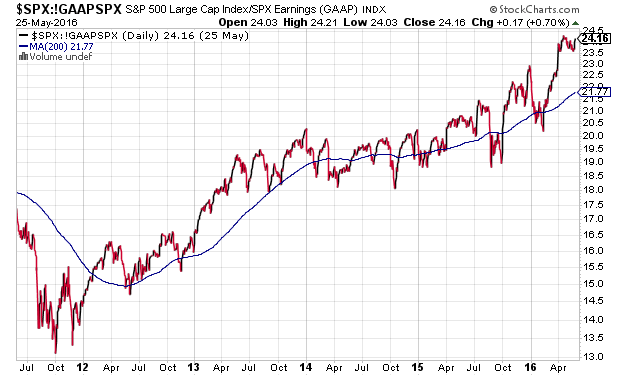
The rift between sales and earnings estimates leads to questions about stock valuation. One way to gauge whether stocks are undervalued, fairly valued or overvalued is to compare current stock prices to trailing 12 months of profits. The price-to-earnings (P/E) ratio for the S&P 500 at 24.2 far exceeds the long-term average of 16.7 or near-term average of 19.5.
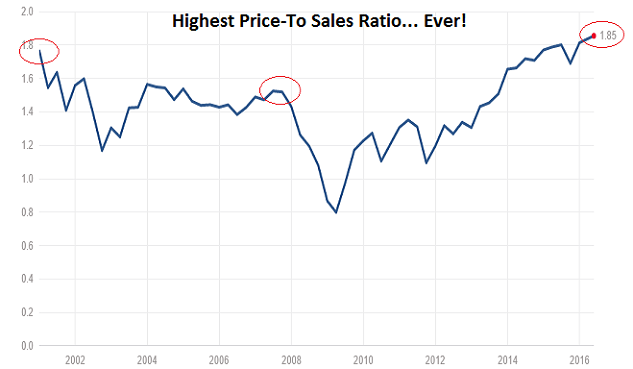
Another way to get a feel for the price one is paying for equity ownership? Compare the S&P 500’s price with current sales. On this particular measure, stock valuations have exceeded levels reached at the height of New Economy (dot-com) euphoria in 2000.
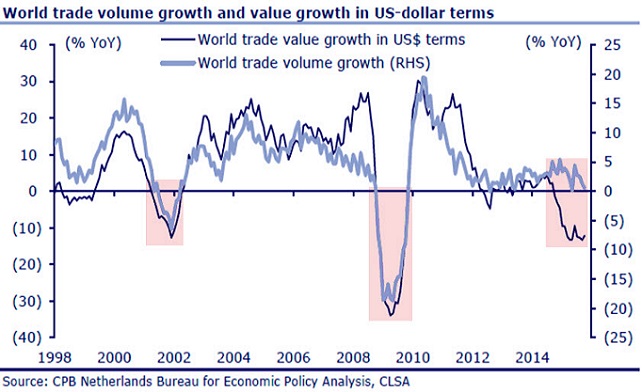
The sales slowdown is not confined to U.S. borders. The deterioration in world trade value (in dollars) is reminiscent of previous business cycles.
Some make the case that the U.S. economy is relatively immune to economic deterioration abroad. Their economies are dependent on manufacturing and exports; “ours” is dependent on consumer spending. That said, year-over-year retail sales suggest that spenders are not spending as much as they used to spend.
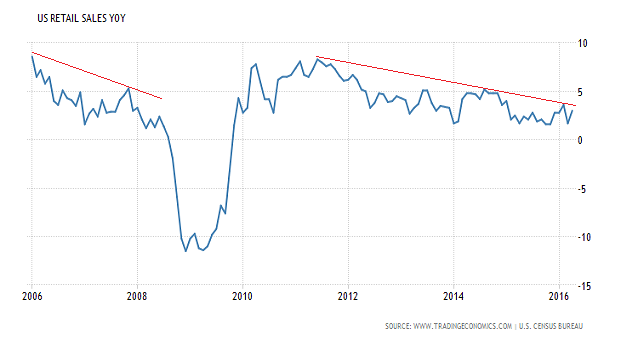
Is it realistic to expect that domestic consumption will pick up dramatically? Enough to improve the sales prospects of U.S. corporations going forward? Probably not.
Americans already spend more than they earn after taxes; they’ve been doing so since 2001. Nevertheless, families can only increase their debt levels for so long before they are forced to deleverage or choose to retrench.
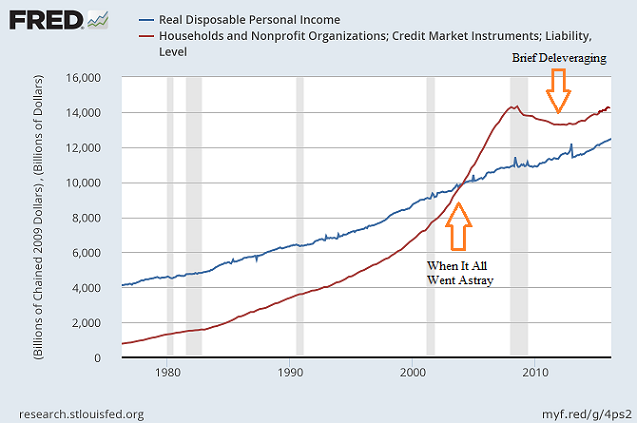
Since households are already stretched thin, business and government spending may need to contribute more than usual. Yet borrow-n-spend governments – city, state and federal – are currently dealing with deficit-weary citizens.
What’s more, corporations have already leveraged themselves to the hilt. Previous corporate borrowing binges accompanied the last three recessions.
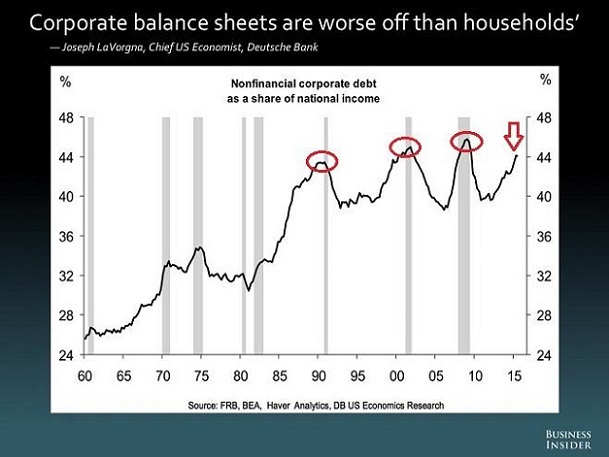
How can corporate balance sheets be so unhealthy with a record $1.84 trillion cash on the books? Everything is relative.
With American companies having grown their debt obligations at a double-digit annualized rate to $6.6 trillion, their collective cash-to-debt ratio is lower than at any time since 2008’s financial collapse.
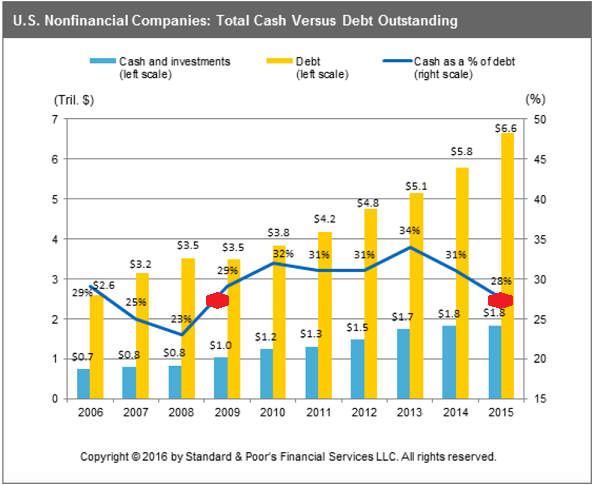
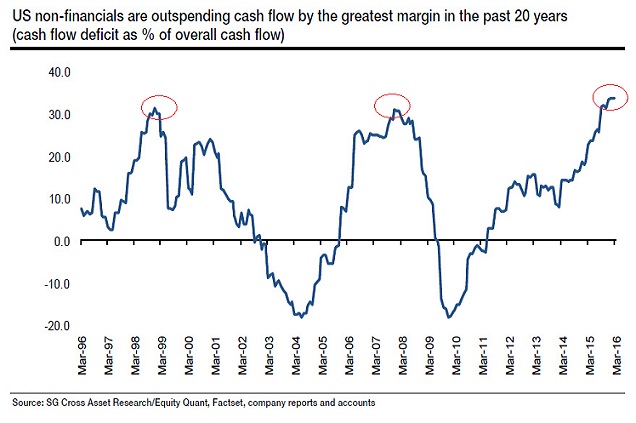
Ratings agencies (S&P, Moody’s, etc.) often downgrade the bonds of companies that have low cash-to-debt ratios. Downgrades can lead to higher borrowing costs when existing bonds mature and new bonds need to be issued. With corporations outspending free cash flow by the greatest margin in several decades, voluntary or involuntary deleveraging (and defaults) is a near-term inevitability.
At least in previous credit cycles, corporations used the debt to finance capital expenditures like property, industrial buildings and/or equipment. Capital expenditures typically represent investment in longer-term growth. Since the Great Recession, however, companies have largely chosen to funnel borrowed dollars back into the purchase of respective stock shares. The practice may bolster stock prices in the near-term, though it offers little promise for longer-term well-being (e.g, profitability growth, sales growth, etc.).
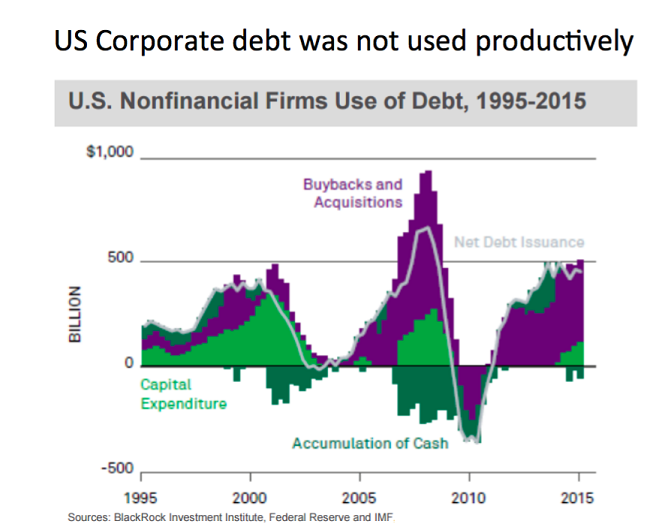
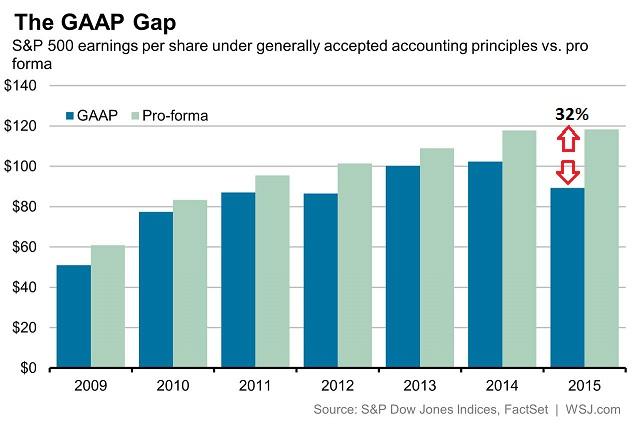
Indeed, borrowing to buy back stock shares has not only led to balance sheet deterioration, it has led to degradation in earnings quality. What do I mean?
Corporations report two kinds of results – generally accepted accounting principles (GAAP) earnings and “adjusted” pro forma earnings. Lower quality non-GAAP earnings per share usually deviates from higher quality GAAP-based earnings per share by about 10%. The gulf widened to 20% in 2014 and more than 30% in 2015.
Perhaps one could make the case that an investor need not be concerned about trivial matters such as disintegrating earnings quality, deteriorating balance sheet health, diminishing world trade, waning business sales or stock valuation extremes. One might argue that as long as corporations can access low-rate borrowing terms, they will be able to spend more than they earn indefinitely. Heck, families have been doing so for 15 years. The U.S. government? It never stops spending more than it takes in from tax revenue.
Wishful thinking notwithstanding, the stock buyback train is already slowing down. Announced share buybacks have fallen off sharply.
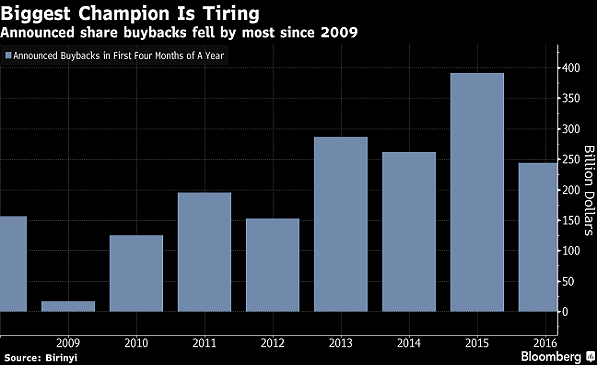
Why might few stock buybacks be exceptionally detrimental for stock assets? That could spell trouble for stocks because “Mom-n-pop” investors, pension funds, hedge funds, private clients, institutional investors have all been net sellers for 17 consecutive weeks. That means stock market bullishness could be setting itself up for a hard fall if the only net buyer of stocks, corporations, is unable or unwilling to keep buyback promises.
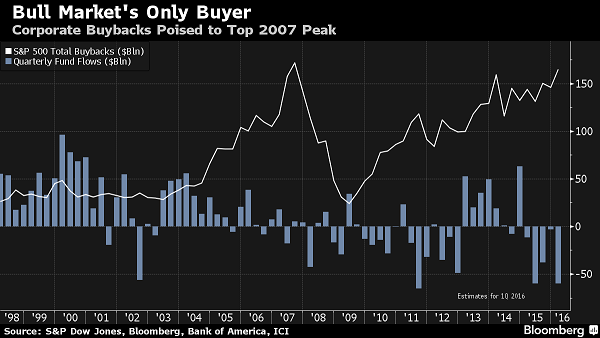
So you tell me. Have ultra-low borrowing costs over-inflated stocks, bonds and real estate, creating a third credit balloon? Or is this time really different?
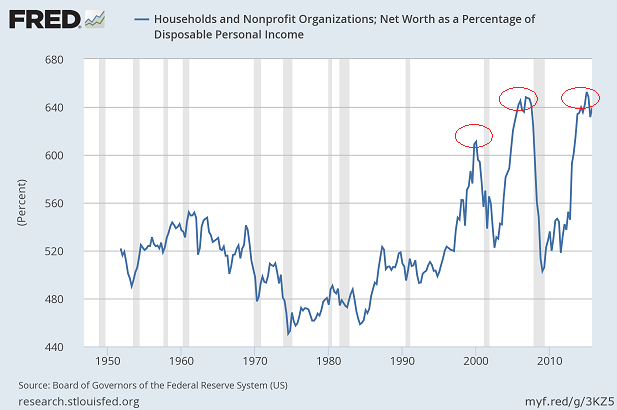
Judging by household net worth as a percentage of real disposable personal income, it appears the risk of adding to one’s stock exposure today outweighs the potential for reward.
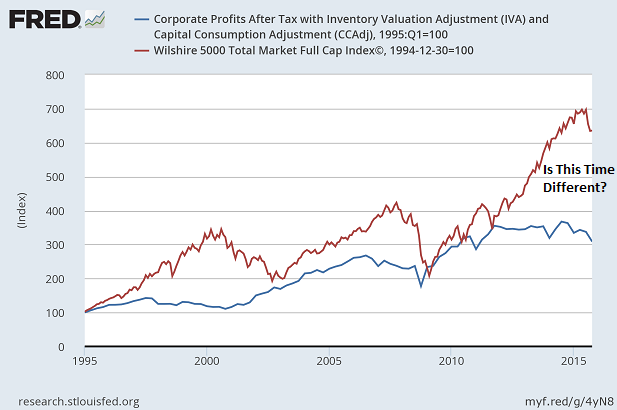
One last thought. There’s a historical tendency for stock prices to revert back to mean valuation levels. If this time is actually going to be different, corporate profits will not only need to turn higher after four consecutive quarters of declines, but stocks will need to ignore the monstrous void between prices and profits.
Disclosure: Gary Gordon, MS, CFP is the president of Pacific Park Financial, Inc., a Registered Investment Adviser with the SEC. Gary Gordon, Pacific Park Financial, Inc, and/or its clients may hold positions in the ETFs, mutual funds, and/or any investment asset mentioned above. The commentary does not constitute individualized investment advice. The opinions offered herein are not personalized recommendations to buy, sell or hold securities. At times, issuers of exchange-traded products compensate Pacific Park Financial, Inc. or its subsidiaries for advertising at the ETF Expert web site. ETF Expert content is created independently of any advertising relationships.
