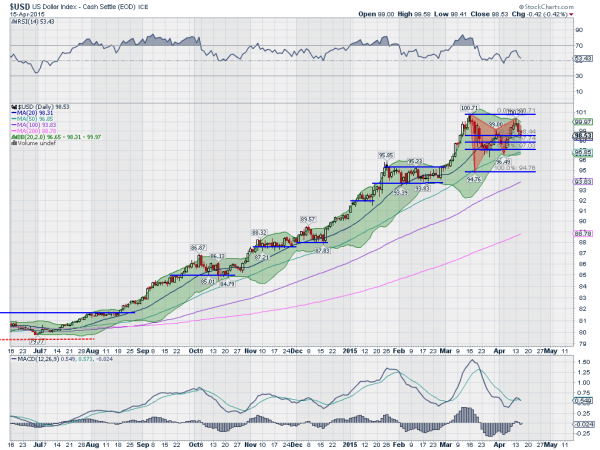
US dollar strength has been a major focal point in the financial markets. Since it took off last July, the Dollar Index has risen 25%. That will get some attention whether it is caused by weak global currencies or strength at home. With the consolidation after it peaked, over 100, in March, many are wondering if the currency's strength is over. Only time will tell. But there are some interesting clues playing out in the chart of the price action, below.
A very orderly stair step fashion represents the rise. That is, until it hit 100.71 in early March. Since then it has been in a broad, messy consolidation with a bizarre intraday sell-off that occurred two days after the peak.
However, on close inspection that mess reveals itself as a harmonic pattern. And that spike down is significant. The 2 triangles outline the ‘W’ shape of a bearish harmonic Bat. That pattern completed Monday with a touch at the 88.6% retracement of the initial downward leg on the spike.

The reversal has now met its first target at 98.44, a 38.2% retracement of the entire pattern. It can easily reverse higher here or continue to the next target at 97.03, a 61.8% retracement. Either one would show continued strength and have no impact on the uptrend from July.
It is also worth noting the role that the 50 day SMA is playing in this consolidation. There have been two touche and two bounces at that level now. A continuation to that 97.03 level would be a third touch if it takes more than 1 day. Finally note the role of the Bollinger Bands®. Over the course of the run up from July the moves higher happened after a tightening in the Bollinger Bands, a squeeze. Also the Index has not been outside of the Bollinger Bands for more than 2 closes in a row, and more typically just one. The Bollinger Bands have been touched 3 times in the latest consolidation as well. Each time they have been tested they have held. And now they are tightening.
Will the move out of the squeeze be to the upside or the downside though? The macro factors (weak euro, weak yen, weak yuan) all favor the upside. The RSI also favors this direction as it remains in the bullish zone. But the MACD that had been bouncing back higher, has just crossed down. This favors the downside. At least short term.
A continuation to 97.03 and then a possible bounce fits this set up very well. Lets watch and see what happens.
Disclosure: The information in this blog post represents my own opinions and does not contain a recommendation for any particular security or investment. I or my affiliates may hold positions or other interests in securities mentioned in the Blog, please see my Disclaimer page for my full disclaimer.
