
Closed-end funds (CEFs) are an often overlooked corner of the market. They are publicly traded investment companies which raise a fixed amount of capital via an IPO by issuing a fixed number of shares. They are actively managed, often employ leverage, and typically represent a specific segment of the securities market. They trade throughout the day on exchanges, just like a stock or ETF, with their share price determined by market demand. However, a key component of CEFs is that they issue a fixed number of shares which represent an interest in the underlying securities of the CEF, which means the CEF not only has a share price but also a Net-Asset-Value (NAV). The value of the underlying securities held by the CEF determines its NAV, while the daily trading prices of a CEF are determined by the market – buyers and sellers of stock in the CEF. Thus, it is possible for a CEF to trade at a discount or premium to its NAV.
The CEF universe is often inefficient and investors can exploit these inefficiencies by purchasing CEFs trading at discounts to their NAV. I consider this a potential “value” play – by purchasing a CEF at a discount to its NAV we are essentially purchasing the underlying securities held by the CEF at a discount to their price.
I am not concerned with “why” CEFs may trade at a discount or premium. If there is a dollar laying on the street, I am going to pick it up rather than worry about why nobody else has already done the same. I want to know if the discount can be systematically exploited over time.
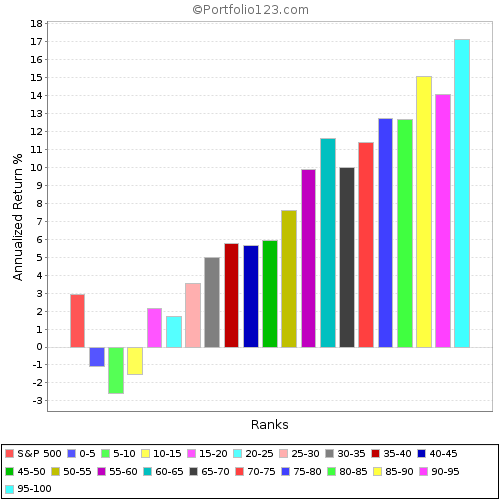
Using Portfolio123 I first created a ranking system which ranked CEFs based on their discount or premium to NAV (a value-only strategy). CEFs with the highest discount to NAV received the highest ranking. The test below sorted CEFs into 20 buckets and as you can see the bucket with the highest discount to NAV produced the highest average annual returns with a fairly consistent decrease in annual returns as the discount to NAV decreased:
Note: All of the subsequent tests were run from 1/2/99 – 10/22/14.
Next, we employ a momentum overlay to the strategy. Regular readers of my site, Scott’s Investments, know I am a proponent of momentum and trend following strategies. I created a rank system which ranked CEFs based on both their discount to NAV and their 6 month total return, giving us a value and momentum system. CEFs with a high discount to NAV and high 6 month total returns (share price returns, not NAV returns) received the highest rank:
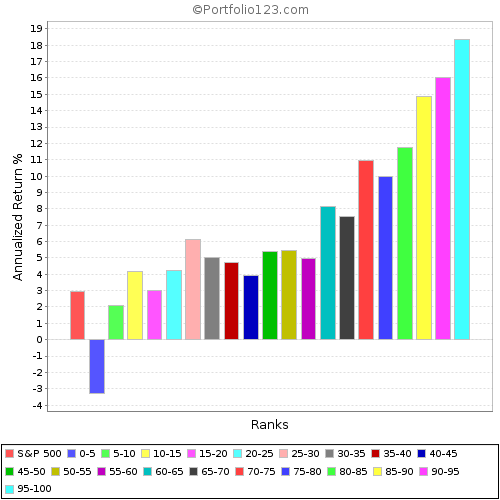
We see similar results as the value-only strategy but with even higher returns in the top ranked buckets.
How do these strategies perform real-time, with real securities and turnover? Below is a backtest of the value and momentum system. The first test held 20 CEFs and they were required to have 20-day average share volume of 5000 shares or greater and a closing price greater than $2. It also assumed 0.5% slippage to account for bid/ask spreads and made transactions at the next day’s closing price to help give a realistic execution of a live strategy. The strategy ranked CEFs every 4 weeks, and those no longer rated in the top 20% were sold and replaced with the highest rated CEF. I chose the 20% threshold to help reduce turnover, thereby limiting expenses. The results:


The next test used the same parameters as above with one addition. CEFs were required to have positive 6 month total returns. CEFs were sold when their 6 month total returns dropped below 0%. This filter helped during 2008 to reduce portfolio drawdowns:


I have two CEF portfolios currently available on Portfolio123 (search “CEF Value Momentum ” and “CEF Value Momentum 20 “, which will be available in 14 days). They use similar parameters to the ones presented here.
A word of caution on the data presented here. Fifteen years feels like a really long time, but does not give us robust results when backtesting strategies. Secondly, data-snooping is always a concern. Changing parameters of the system impact results and the more complex a system the more susceptible it is to data-snooping. Thus, I tried to keep the systems presented here simple. Finally, taxes and other trading costs will impact results.