T2108 Status: 62.2%
T2107 Status: 48.3%
VIX Status: 17.3
General (Short-term) Trading Call: Mildly bearish (S&P 500 nudged over 50DMA with overhead resistance looming directly overhead. See below for more caveats)
Active T2108 periods: Day #73 over 20%, Day #32 above 30%, Day #12 over 40%, day #1 over 60% (over period, ending 41 days under 60%, skipped right through 50s range!), Day #143 under 70%
Commentary
I was not able to post a T2108 Update for the first trading day of this month. At the time, I wanted to point out the persistence of the pivot around the starting line for December’s Santa Claus rally. Instead, the better storyline is the sudden surge of T2108 towards overbought conditions that still has my head spinning. T2108 jumped 13.1 percentage points, a 26.7% increase, which completely blew through the 50s range. I cannot even remember the last time I observed such a jump. I am posting the candlestick chart of T2108 to emphasize this dramatic move.
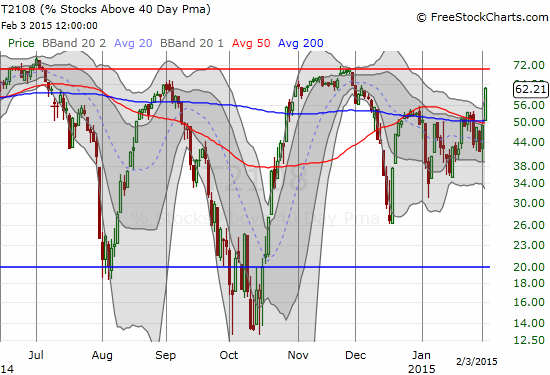
T2108 broke out of a trading range and surged toward overbought conditions. The apparent breakout of T2108 represents the most important feature of this chart. This trading range has been in place ever since T2108’s close encounter with overbought conditions in late November (some might call this apttern more of a rising wedge). The S&P 500 (ARCA:SPY) has been stuck in a trading range since then as well. So T2108’s breakout represents a potential bullish divergence that portends an eventual breakout of the S&P 500. Note that I am NOT ready to project such an event and prefer to wait for the market to prove itself.
For now, I am keeping the short-term trading bias on bearish in deference to looming overhead resistance from the top of the trading range. I am also NOT recommending any new short positions. Better to let the market prove itself to the downside from here as well.
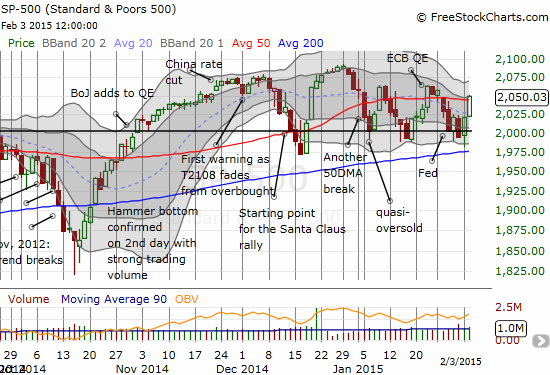
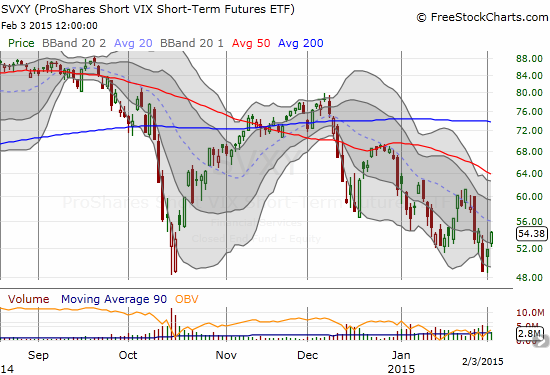
The S&P 500 nudged past its 50DMA but remains well within its trading range. As the S&P 500 pushed upward again, volatility pushed downward again. My bet last Friday to fade the volatility surge worked out as well as I could have expected. It took just two days for ProShares Short VIX Short-Term Futures (ARCA:SVXY)) to recover its losses.
ProShares Short VIX Short-Term Futures (SVXY) recovers all its losses from Friday’s “blip”
I sold my SVXY shares on the pop on Monday. I was hoping for some chop that would give me a fresh entry point. Instead, the VIX is resting on its 50DMA again.
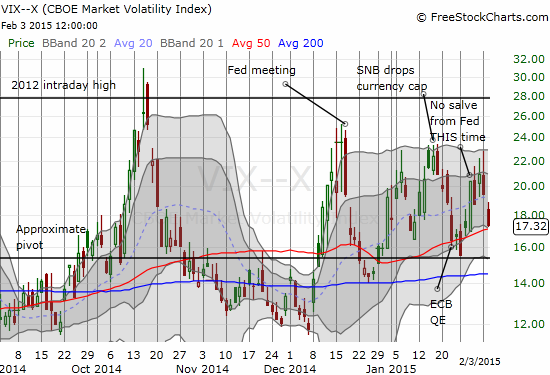
The volatility index, the VIX, drops back to its 50DMA. Oil’s sudden surge makes these past few trading days feel like a potential market pivot point. In fact, outside of gold, commodities rallied across the board it seems as the U.S. dollar (NYSE:UUP) got clobbered.
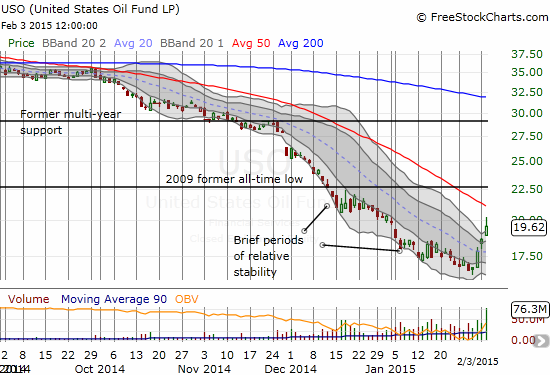
Oil’s sharp rise has sent the United States Oil ETF (NYSE:USO) up 17% in 3 days.
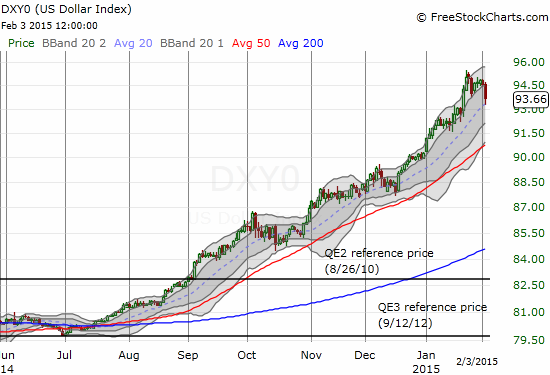
The dollar index “only” lost 1% today, but the drop was enough to drag the dollar out of its primary uptrend for the first time since mid-December. I am skeptical that oil has finally bottomed (one of these days I will write a complete piece throwing my hat into the cauldron of opinions on oil).
Accordingly, I have started building a short-term position in Direxion Daily Energy Bear 3X ETF (NYSE:ERY). The moves in oil and the dollar need close monitoring because so many traders and investors are trying to draw clues from these signals. I for one find it strange to buy the stock market because oil is strong: there goes my discount at the gas pump and poof will go all that boost in GDP that central banks, the IMF, and World Bank and others keep claiming comes from cheaper oil.
I think the more or less soothing commentary from earnings calls from oil companies have helped oil to find a short-term bottom here. For example, these quotes from Seeking Alpha’s transcript of the earnings call from Anadarko Petroleum (NYSE:APC) suggest a bottom is underway:
“I think today we would concur with those that are in the camp that think we have a U shape. We’re not anticipating it being V shaped… I am not sure anyone believes that by the time we get around to the end of this decade oil is going to be where it is today…We don’t anticipate having a worse oil environment in the second half of year. I think we are sort of inclined to believe that oil will continue to recover. How much it recovers and how quickly it recovers, I am not in a great position or a better position to answer that than anyone else. But when costs sync up with the new commodity environment that we are in I think that is when we as industry and we as a company will be able to give you the types of color around how much growth we would anticipate having.”
I am not sure whether these same companies were very helpful in predicting last year’s TOP in oil prices. Having said that, I made sure to jump into a bunch of call options in Linn Energy, (NASDAQ:LINE) since it has tremendous upside potential if indeed oil has bottomed here. A continued rally in LINE should more than pay for any losses. I suffered getting stopped out of (NYSE:ERY) shares.
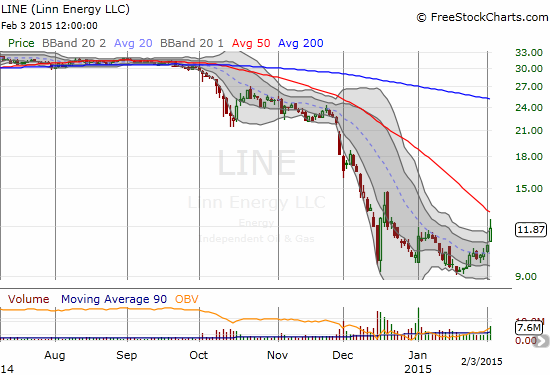
Linn Energy surged 10% yesterday and are already up 28% from its lows. On to some individual stock charts. Intel (NASDAQ:INTC) has been putting up an excellent fight at its 200DMA. Yesterday’s bounce was even stronger than Monday's. Ever since the Microsoft (NASDAQ:MSFT) inspired dip, I have activated my “buy Intel between earnings” strategy. My first foray was in the immediate aftermath of MSFT’s earnings as INTC pushed beyond its lower Bollinger Band® (BB). I got the bounce I wanted the same day, and I sold out. I bought again on the next two dips and am now waiting for this 200DMA retest to resolve into at least a filling of the gap down and a test of the 50DMA resistance.
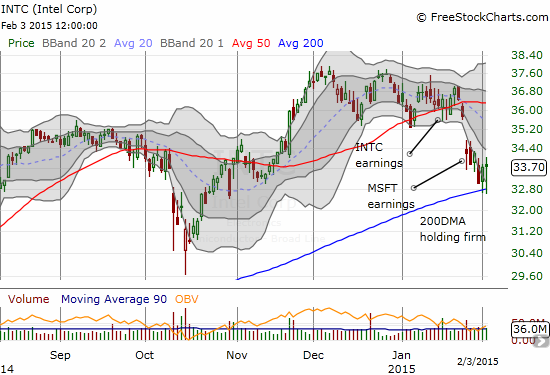
Intel (INTC) is holding firm to its 200DMA support with a particularly strong bounce yesterday.
Caterpillar (NYSE:CAT) is also reaching into a gap, this one formed by its own earnings. As T2108 approaches overbought status, CAT’s relief rally (dead CAT bounce?!) becomes a prime target for hedging longs again. I may not even wait for overbought to start buying into put options again.
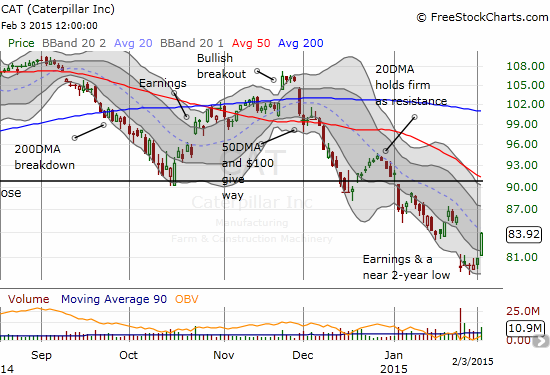
Caterpillar, Inc. (CAT) starts to bounce back from a post-earnings disaster. Europe has taken center stage in economic headlines, and I am watching more closely than ever. After the European Central Bank (ECB) rolled out quantitative easing (QE) I started watching iShares MSCI Germany (EWG).
Given Germany is by far the strongest country in the eurozone – and a country least in need of structural reforms, it seems to me that this country will benefit the MOST from a collapsing value of the euro (FXE). After all, Germany is heavily dependent on exports. After seeing the rally of recent lows continue after the ECB’s QE, I pulled the trigger on a fist full of call options on EWG. Today, EWG peaked over its 200DMA for the first time since last July. EWG is approaching a 5-month high and has finally produced a higher low and higher high, key ingredients for a bottom.
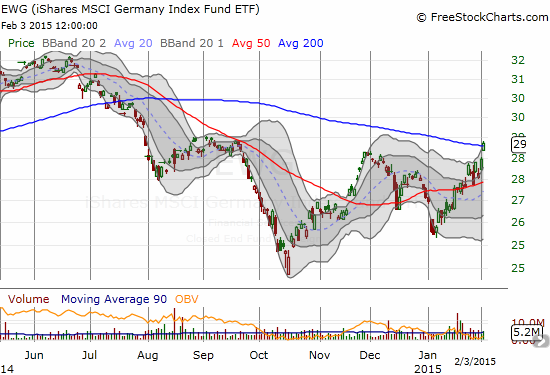
iShares MSCI Germany (iShare MSCI Germany (ARCA:EWG) makes a potentially important breakout above its 200DMA.
For comparison, here is the lagging performance of Spain.
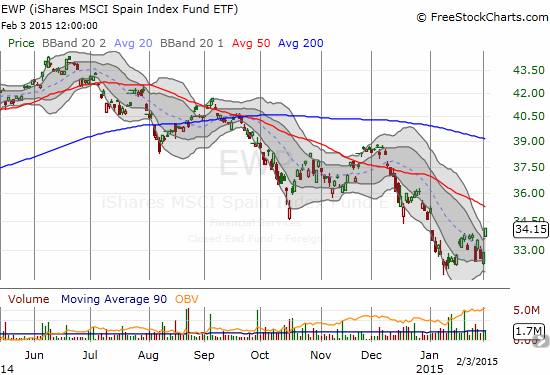
iShares MSCI Spain Capped (ARCA:EWP) is barely off its recent lows within a downtrend well-defined by a declining 50DMA.
Daily T2108 vs the S&P 500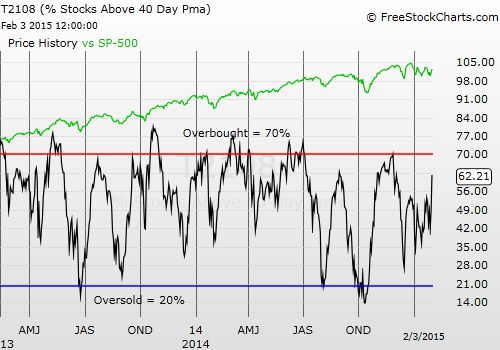
Black line: T2108 (measured on the right); Green line: S&P 500 (for comparative purposes)
Red line: T2108 Overbought (70%); Blue line: T2108 Oversold (20%)
Weekly T2108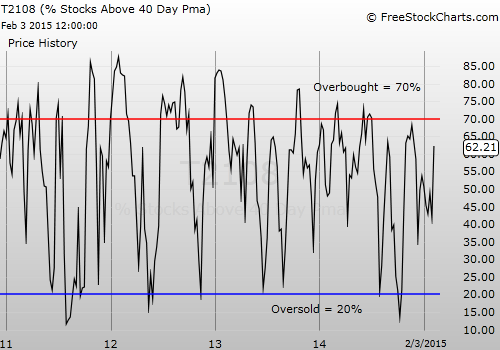
Disclaimer: long LINE call options, long ERY, long EWG call options, long INTC call options, net long the U.S. dollar, long MSFT put options

