Get 40% Off
🚨 Volatile Markets? Find Hidden Gems for Serious OutperformanceFind Stocks Now

The Soybean Charts You Need To See

Published 05/20/2015, 02:19 PM
Updated 07/09/2023, 06:31 AM

The agribusiness world does not want to believe soybeans can return to $7.50.

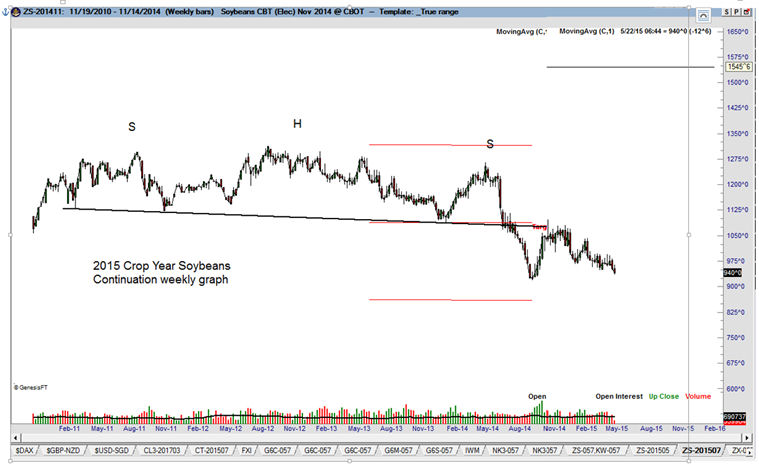
But the chart shown below suggests such a decline is very possible. Factor is the only trading firm that has constructed a 2015 crop year graph.

The weekly graph is a construct shown by no other printed or online chart service. The chart displays only the 2015 Soybean crop year. The chart is constructed by only using crop year 2015 contracts on a continuation basis.

As shown, the 2015 Soybean crop year completed a massive 43-month H&S pattern in Aug 2014. The rally into the Nov 2014 high was simply a retest of this top. This H&S pattern has targets as low as $6.50, but the $7.50 to $8.25 zone is more realistic.

Weekly Soybeans

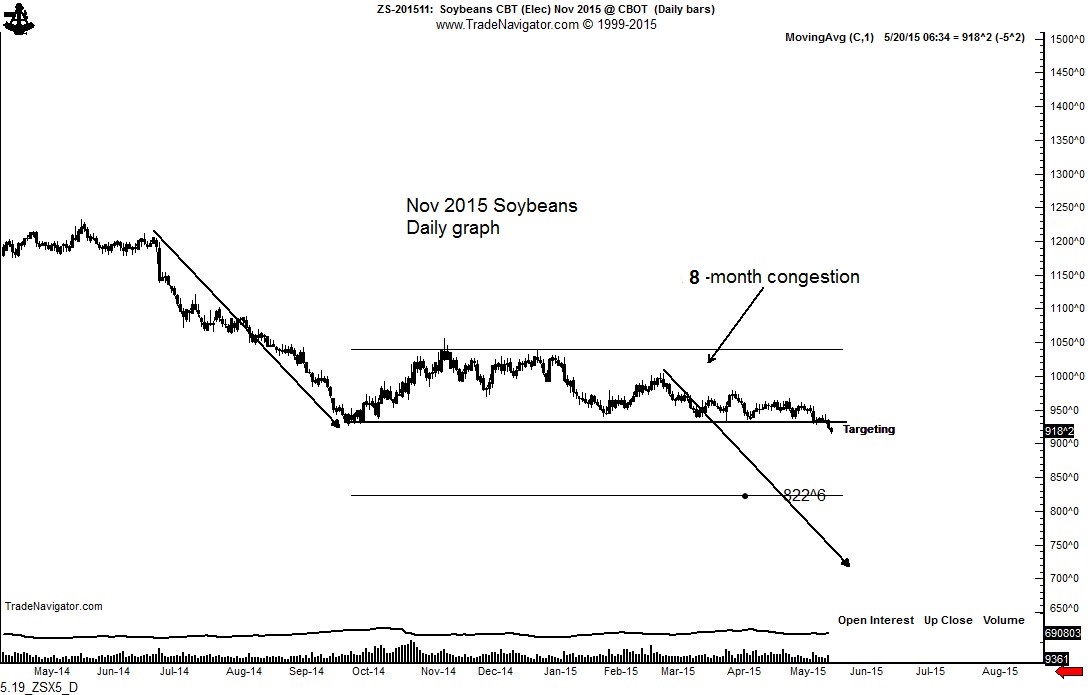
Assuming normal growing conditions in 2015, the fall harvest will bring all-time record Soybeans supplies to market. The daily chart of the Nov 2015 contract posted a new contract low this week and has completed an arguable 8-month descending triangle. An advance above 9.73 would cast some doubt on this interpretation. Only a close above 10.10 would negate this analysis.

Daily Soybeans

Disclosure: Factor is short Soybean futures

Latest comments

Risk Disclosure: Trading in financial instruments and/or cryptocurrencies involves high risks including the risk of losing some, or all, of your investment amount, and may not be suitable for all investors. Prices of cryptocurrencies are extremely volatile and may be affected by external factors such as financial, regulatory or political events. Trading on margin increases the financial risks.
Before deciding to trade in financial instrument or cryptocurrencies you should be fully informed of the risks and costs associated with trading the financial markets, carefully consider your investment objectives, level of experience, and risk appetite, and seek professional advice where needed.
Fusion Media would like to remind you that the data contained in this website is not necessarily real-time nor accurate. The data and prices on the website are not necessarily provided by any market or exchange, but may be provided by market makers, and so prices may not be accurate and may differ from the actual price at any given market, meaning prices are indicative and not appropriate for trading purposes. Fusion Media and any provider of the data contained in this website will not accept liability for any loss or damage as a result of your trading, or your reliance on the information contained within this website.
It is prohibited to use, store, reproduce, display, modify, transmit or distribute the data contained in this website without the explicit prior written permission of Fusion Media and/or the data provider. All intellectual property rights are reserved by the providers and/or the exchange providing the data contained in this website.
Fusion Media may be compensated by the advertisers that appear on the website, based on your interaction with the advertisements or advertisers.
© 2007-2024 - Fusion Media Limited. All Rights Reserved.