Stocks are tumbling in Russia, Brazil, Chile, South Africa, Australia and Canada due to economic weakness in China. Meanwhile, the Vanguard Europe ETF (NYSE:VGK) remains roughly 5.5% off of its May high, as the feel-good effect of $1.3 trillion in European Central Bank stimulus subsides.
In truth, risk assets from across the spectrum are fading. Exchange-traded vehicles as diverse as iShares High Yield Corporate Bond ETF (NYSE:HYG), iShares Russell 2000 Fund (NYSE:IWM), iPath Commodity ETF (NYSE:DJP) and Vanguard FTSE Emerging Markets (NYSE:VWO) are all battling downtrends.
Historically, there is a strong correlation between sharp declines in a wide variety of riskier assets and the S&P 500. Here in 2015, however, the S&P 500 has been nearly as defiant as those investors who have placed all of their eggs in the benchmark’s basket. How defiant? The S&P 500 SPDR Trust (NYSE:SPY) is a mere percentage point off of its all-time record.
The popular S&P 500 benchmark has several sub-components (e.g., energy, materials, industrials, etc.) that have already succumbed to downtrends. Still, the large-cap U.S. stock proxy has held firm. On the flip side, however, a cornucopia of warning signs suggest caution. Signs of a market top are evident in corporate data, respected valuation methods, economic facts, overall U.S. market price movement and investor sentiment.
Here are 15 indications that the S&P 500 is near a market top:
CORPORATE
1. Dividends are Decreasing. According to S&P, there were 696 reported dividend increases in the second quarter of 2014. In the second quarter of 2015? Only 562. That represents a 19.3% decrease. Equally disconcerting, 57 corporations decreased their dividends in the first quarter whereas 85 companies dropped the bomb in the second quarter. Dividend decreases have now reached their highest point since 2009.
2. Questionable Accounting. Thomson Reuters is reporting that second-quarter earnings growth should come in at 1.2%. That’s relatively flat, but it is not necessarily the end of corporate profitability. Or is it? According to data from S&P Dow Jones Indices, Q2 profits should chime in at $22.85 a share. That’s down a dramatic 15.8% from one year earlier. Accounting shenanigans? That depends upon who you ask. S&P’s data employs generally accepted accounting principles (GAAP) were all expenditures are included. Thomson Reuters? They get their numbers from the analysts who often pull out costs when the corporations themselves exclude those costs.
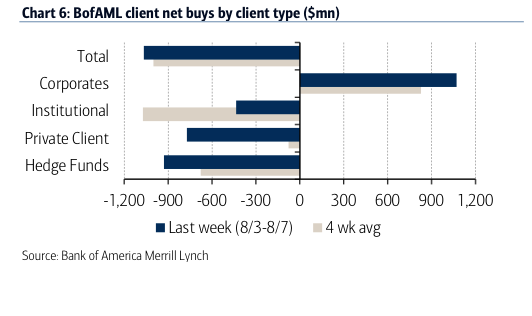
3. Buybacks may be the Only Support. Stock buyback programs have never been about identifying attractive valuations. They’re about the short-term allocation of inexpensively borrowed capital to reduce share count, improve perceived profitability per share and gloss over revenue declines. Unfortunately, when revenue shortfall meets with higher corporate borrowing costs (a la wider credit spreads), those price-insensitive repurchase programs wind up becoming the only support for the market itself. Bank of America/Merrill Lynch recently broke down net stock acquisitions/dispositions by client type and found that corporations are the only net buyers.
4. Corporate Debt Levels Are Hitting Extremes. Are companies sitting on stockpiles of cash? Borrowed cash, and probably not as much as many folks think since so much of that cash went into buying back stock shares. Corporations are highly indebted. They’ve even increased their debt obligations by 25% since 2009. In fact, non-financial corporations are more leveraged at 37% than they were in 2007 at 34%. What happens when the borrowing costs rise on the 7-year corporate credit bonds that have been issued? Too much leverage is a probable warning sign.
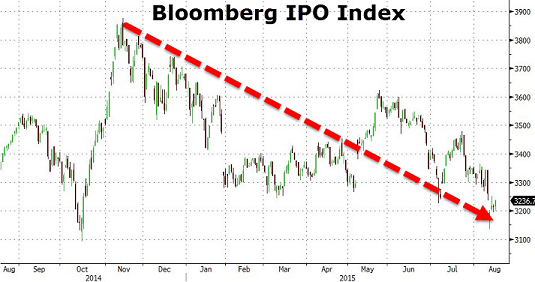
5. IPOs Oh No? The last time that the S&P 500 experienced a meaningful correction of 19%-plus occurred during the euro-zone crisis of 2011. Yet they battled back to end the year at the break-even point. Conversely, IPOs in the Bloomberg IPO Index fell 23.3% in the calendar year 2011. So far in 2015, the Bloomberg IPO Index has already hit a correction with declines of more than 10% year-to-date. Depreciation from the November 2014 highs is even greater.
VALUATION
6. Exorbitant P/Es, Forward Or Backward. Goldman Sachs recently dispelled the myth that low interest rates alone justify higher price-to-earnings ratios. According to their data, the forward 12-month P/E averaged 11.2 when real interest rates were between 0% and 1%. Forward P/E today? 16.7. Stocks would need to drop by 1/3 in value to revert to the mean. 12-month trailing P/Es, you ask? According to S&P, the index is pushing 22.2 with the recent decline in S&P’s estimates of earnings. Reversion to the mean here would also require a 33% decline in current pricing.
7. Unsustainable P/S Ratios. Ed Yardeni pegs the S&P 500 at 1.85. That’s the 2nd highest in history when the P/S surpassed 2.0 in 2000. With two consecutive quarters of declining sales (a.k.a. “a revenue recession”), it is difficult to see how that ratio does not get more out of whack.
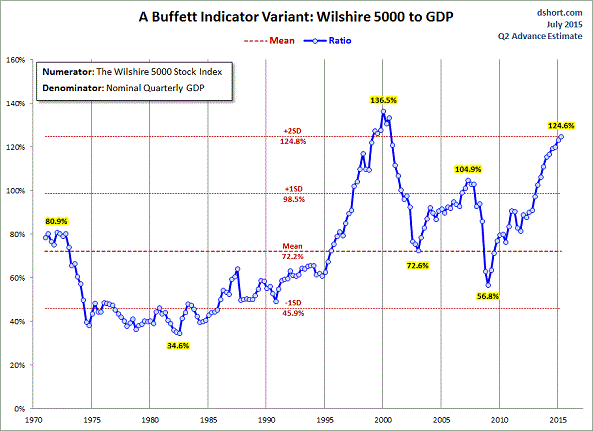
8. Market Cap-to-GDP is Scary. Scores of analysts as well as investing oracles like Warren Buffett (NYSE:BRKa) revere this valuation methodology. And why not? According to fund manager, John Hussman, the indicator boasts an impressive track record of 92% accuracy with respect to subsequent 10-year total returns for the total U.S. stock market. As of this moment, the Wilshire 5000 Total Market Index market cap is roughly $21.85 trillion. That’s 125% of GDP. By this metric, the US stock market is only expected to annualize at about 0.3% with returns from dividends over the next decade. (Note: Market cap uses the Wilshire 5000 rather than the S&P 500.)
ECONOMIC
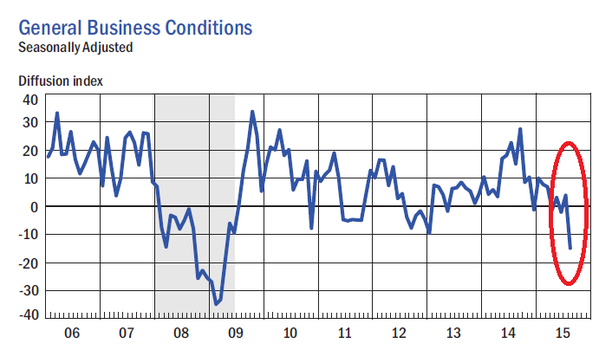
9. Manufacturer Recession? We often hear that the consumer represents two-thirds of the U.S. economy. It seems that many believe this renders the other one-third irrelevant. The U.S. factory sector experienced a six month drop in its output (adjusted for inflation) as it failed to increase between November (2014) and May (2015). Meanwhile, New York-area manufacturing conditions fell so deeply in August, the -14.9 reading on the Empire State Manufacturing Survey is as poor as April of 2009. The Philly Fed’s survey’s most recent readings are consistent with the findings in the New York area, while ISM data is only representing a slowdown.
10. The Consumer Isn’t Spending Enough. Gallup data found that July was the third consecutive month when Americans spent less than they had in the same month in the year earlier. Similarly, year-over-year declines occurred in five out of the seven initial months of 2015. One would be hard-pressed to say that consumers were opening their wallets, let alone spending their gas savings windfalls. Moreover, to the extent that consumer confidence reflects purchasing habits, Gallup’s Economic Confidence Index is near 10-month lows.
11. Fed Tightening in a Weak Economic Environment? For the last three decades, every time that the Fed has tightened monetary policy, an economic slowdown or recession has come to fruition. Then, to stimulate economic confidence, the central bank of the United States resorted to conventional and unconventional tools for lowering interest rates. Bear markets were often involved. More importantly, there are two occasions in history when annualized GDP was lower than 2.5% and the Fed still decided to tighten overnight lending rates. In both instances, recessionary pressures quickened and stock bears occurred within 6-15 months.
CONTRARIAN
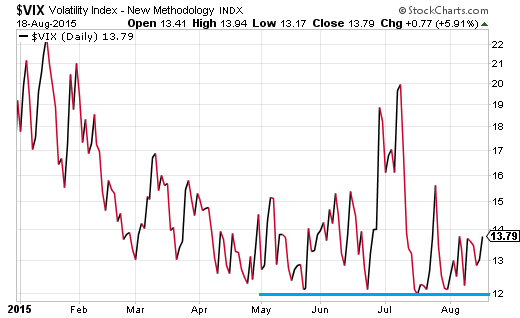
12. “Fear Index” Shows Little Fear. The CBOE S&P 500 VIX Volatility Index (VIX) demonstrates that the investing community simply does not anticipate a mammoth fall from grace. At 13.8, investors are only buying protection associated with a 6.5% drop in the next 30 days. And with the exception of a bit of concern related to Greece back in July, VIX Volatility has remained near its lows throughout the summertime.
MARKET
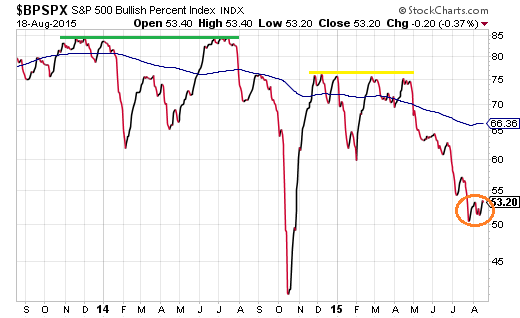
13. Half of the S&P 500 Components are in Downtrends. In a healthy bull market, 75%-85% of S&P 500 stocks are above long-term trendlines and/or demonstrating upward price movement. In 2013 and in the first half of 2014, 85% of S&P 500 stocks exhibited these characteristics as shown in the S&P 500 Bullish Percentage Index. By the second half of 2014 and the early part of 2015, 75% became the new high water mark. Clearly, 3/4 participation would likely suffice in bolstering the U.S. large cap space. Since May, however, the deterioration in market breadth has meant that 1/2 the market is “bearish” and 1/2 the market is “bullish.” Historically, a breakdown in participation tends to foreshadow more severe price pullbacks for key indices.
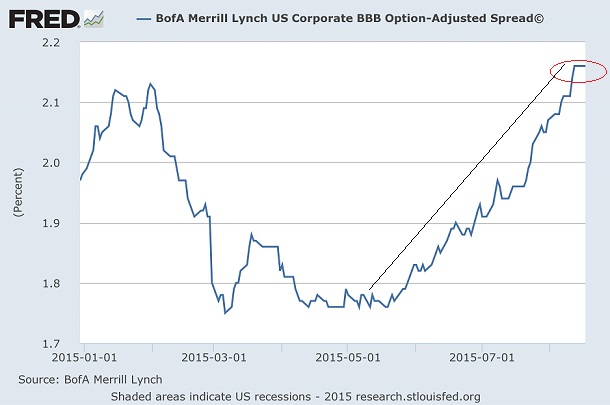
14. Credit Spreads are Widening. Narrowing credit spreads demonstrate greater confidence in the creditworthiness of borrowers. In contrast, widening credit spreads indicate trepidation concerning the ability of corporate borrowers to service their debts. Near market tops, credit spreads are still relatively low, but they begin to rise. And this is precisely the case with respect to the 1.75% spread with BBB junk in May as opposed to the 2.16% that we see today. Investors in lower quality junk are demanding 2.16% more over quality corporate bonds – a spread that is higher than we have seen in more than two years.
15. Flat Market Or Flat Market Plus All of the Other Stuff. According to perma-bulls, the flatness in the S&P 500 cannot tell you anything. After all, when markets were flat this far into a calendar year, they finished the year flat on one occasion, down on three occasions and higher on eight others. Batting .666 then? Perhaps not. For one thing, calendar years are not particularly instructive when it comes to bulls, bears, market tops or market bottoms. We could just as easily be talking about a July to June period or a drawn out two-and-a-half year bear (3/2000 to 9/2002).
Second, and more critically, perma-bulls are explaining away market flatness as though it exists in a vacuum. It does not. It is occurring alongside plummeting commodities, plunging foreign market stocks, deteriorating small-caps, high yield bond distress, a weak economy, a less accommodating Fed, abysmal market breadth, revenue declines, earnings deceleration, extreme U.S. stock valuations and widening credit spreads.
It follows that market flatness prior to the 1930’s 28.5% collapse or the 1941’s 17.5% correction should not be dismissed because of the Great Depression or the Pearl Harbor attack. Granted, the flatness of the market by itself may not tell us anything about what the market is likely to do. Nevertheless, when U.S. large caps are single-handedly holding on for dear life, and virtually every other indication is flashing yellow or red, market flatness is more likely indicative of the calm before the storm.
For those who may find the evidence presented convincing, consider lowering your overall allocation to risk assets. As I have indicated on previous occasions, if your asset allocation target is typically 65% stock (e.g., domestic, foreign, large, small, etc.) and 35% bond (e.g, short, long, investment grade, higher yielding, etc.), you might choose to downshift. Perhaps it would be 50% stock (mostly large-cap domestic), 25% income (mostly investment grade) and 25% cash/cash equivalents. Raising the cash level and modifying the type of stock and bond risk will help in a market sell-off as well as offer opportunity to purchase risk assets at better prices in the future.
In a similar vein, some investors like to take advantage of multi-asset stock hedging. Rather than using leverage, options or shorting, you consider a basket of non-stock assets that tend to do well when stocks are falling apart. The FTSE Multi-Asset Stock Hedge (MASH) Index that my colleague and I created, for instance, incorporates a variety of these asset types, including zero-coupon bonds, long-duration Treasuries, German bunds, gold and the Swiss franc.
Disclosure: Gary Gordon, MS, CFP is the president of Pacific Park Financial, Inc., a Registered Investment Adviser with the SEC. Gary Gordon, Pacific Park Financial, Inc, and/or its clients may hold positions in the ETFs, mutual funds, and/or any investment asset mentioned above. The commentary does not constitute individualized investment advice. The opinions offered herein are not personalized recommendations to buy, sell or hold securities. At times, issuers of exchange-traded products compensate Pacific Park Financial, Inc. or its subsidiaries for advertising at the ETF Expert web site. ETF Expert content is created independently of any advertising relationships.
