
According to the Chicago Fed's National Activity Index, April economic activity slowed from March, now at -0.53, down from March's -0.23. This index has been negative (meaning below-trend growth) for eleven of the past fourteen months. Here are the opening paragraphs from the report: Led by declines in production-related indicators, the Chicago Fed National Activity Index (CFNAI) decreased to –0.53 in April from –0.23 in March. Three of the four broad categories of indicators that make up the index decreased from March, and none of the categories made a positive contribution to the index in April.
The index's three-month moving average, CFNAI-MA3, ticked up to –0.04 in April from –0.05 in March. April's CFNAI-MA3 suggests that growth in national economic activity was very near its historical trend. The economic growth reflected in this level of the CFNAI-MA3 suggests subdued inflationary pressure from economic activity over the coming year.
The CFNAI Diffusion Index increased to –0.03 in April from –0.04 in March. Thirty-two of the 85 individual indicators made positive contributions to the CFNAI in April, while 53 made negative contributions. Forty-four indicators improved from March to April, while 41 indicators deteriorated. Of the indicators that improved, eighteen made negative contributions. [Download PDF News Release]
The Chicago Fed's National Activity Index (CFNAI) is a monthly indicator designed to gauge overall economic activity and related inflationary pressure. It is a composite of 85 monthly indicators as explained in this background PDF file on the Chicago Fed's website. The index is constructed so a zero value for the index indicates that the national economy is expanding at its historical trend rate of growth. Negative values indicate below-average growth, and positive values indicate above-average growth.
The first chart below shows the recent behavior of the index since 2007. The red dots show the indicator itself, which is quite noisy, together with the three-month moving average (CFNAI-MA3), which is more useful as an indicator of the actual trend for coincident economic activity.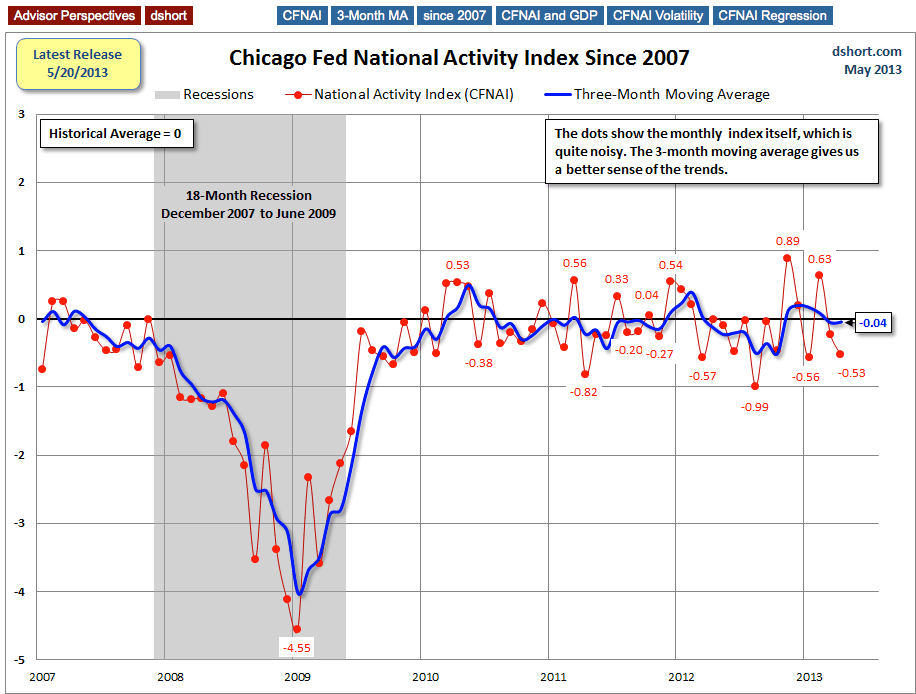
For a broad historical context, here is the complete CFNAI historical series dating from March 1967.
The next chart highlights the -0.7 level.
The Chicago Fed explains:
When the CFNAI-MA3 value moves below -0.70 following a period of economic expansion, there is an increasing likelihood that a recession has begun. Conversely, when the CFNAI-MA3 value moves above -0.70 following a period of economic contraction, there is an increasing likelihood that a recession has ended.
The next chart highlights the -0.70 level and the value of the CFNAI-MA3 at the start of the seven recession that during the timeframe of this indicator. The 1973-75 event was an outlier because of the rapid rise of inflation following the 1973 Oil Embargo. As for the other six, we see that all but one started when the CFNAI-MA3 was above the -0.70 level.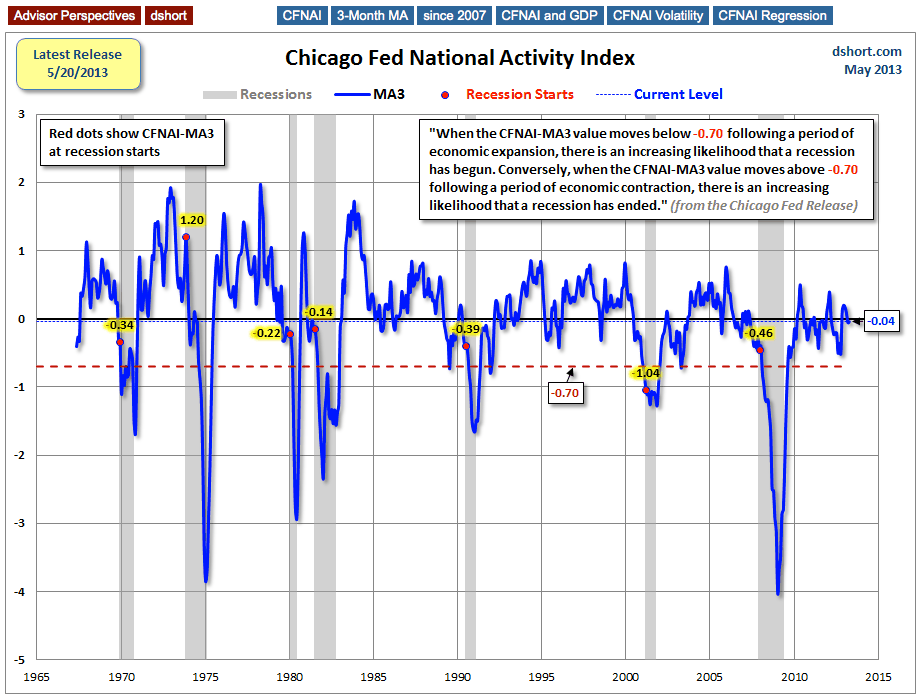
The next chart includes an overlay of GDP, which reinforces the accuracy of the CFNAI as an indicator of coincident economic activity.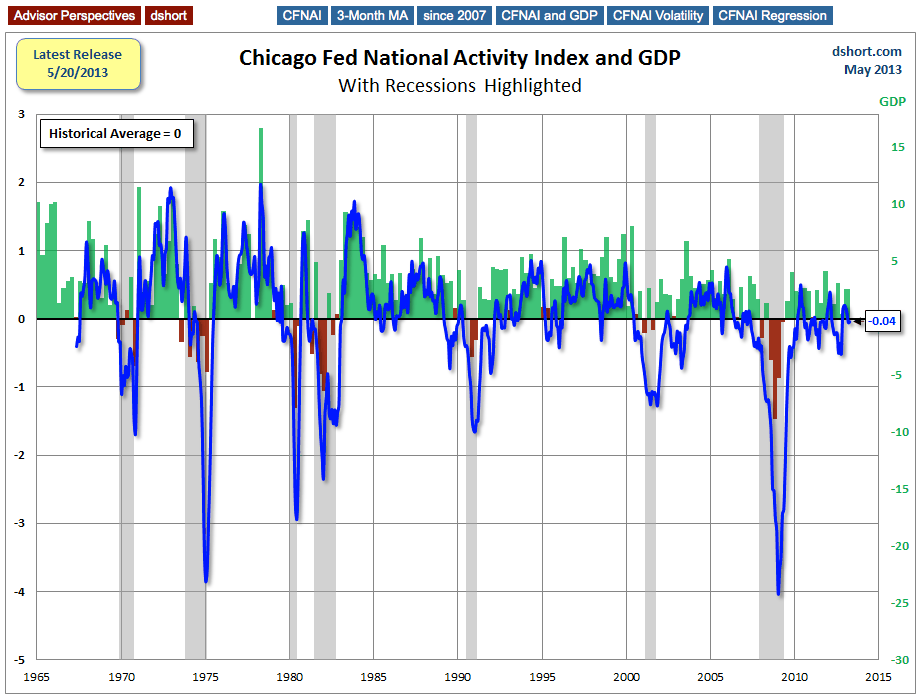
Here's a chart of the CFNAI without the MA3 overlay — for the purpose of highlighting the high inter-month volatility. Consider: the index has ranged from a high 2.64 to a low of -4.90 with a average monthly change of 0.61. That's 8% of the entire index range! The latest reading is a month-over-month change of -0.30, which is half the average volatility.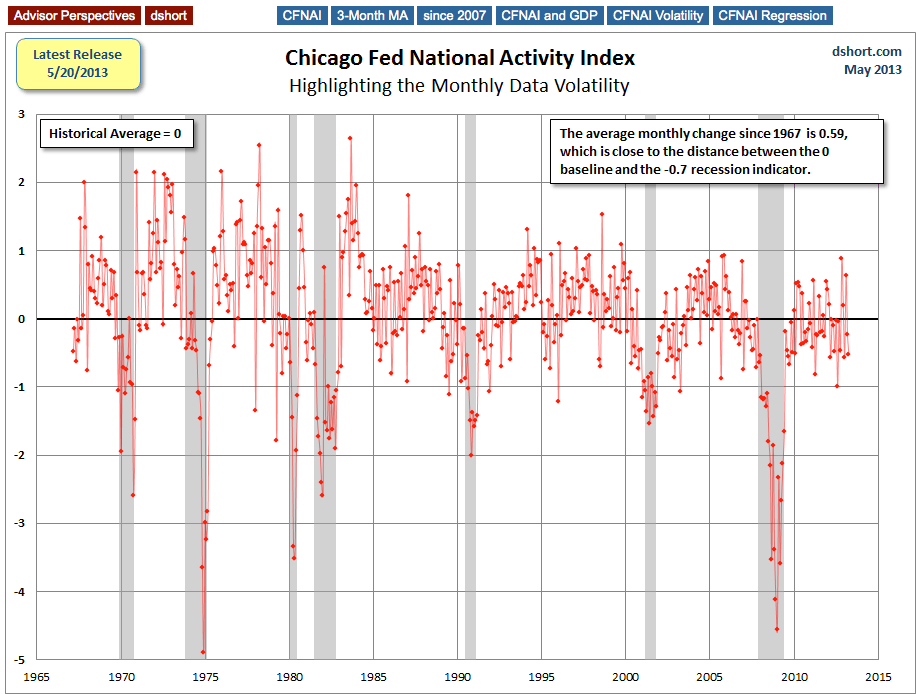
Further underscoring the volatility is the roller-coaster list of CFNAI monthly headlines from 2011 forward.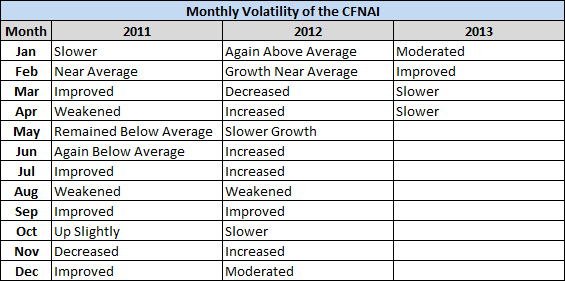
As the monthly chart depicts and the headline verbs reinforce, it's unwise to read very much into the data for any specific month. Also data revisions frequently make the real-time headline subsequently inaccurate. The three-month moving average is a better number to watch.
The Long-Term Economic Trend
In the final chart I've let Excel draw a linear regression through the CFNAI data series. The slope confirms the casual impression of the previous charts that National Activity, as a function of the 85 indicators in the index, has been declining since its inception in the late 1960s, a trend that roughly coincides with the transition from a good-producing to a post-industrial service economy in the information age.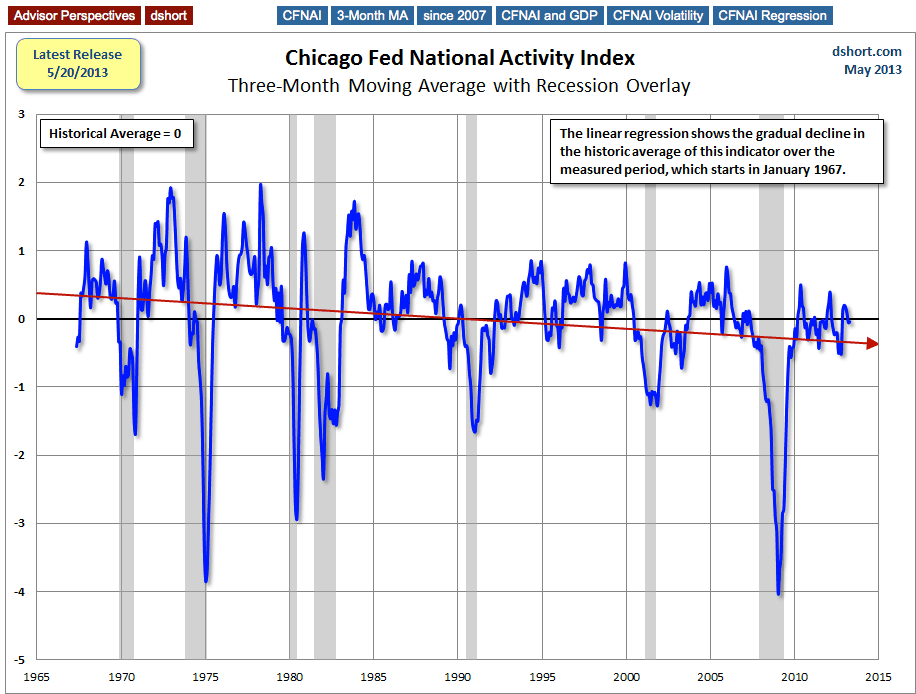
For a more detailed perspective on long-term economic trends, see my latest Understanding the CFNAI Components, which I update and post a few hours after the CFNAI is released.
- English (UK)
- English (India)
- English (Canada)
- English (Australia)
- English (South Africa)
- English (Philippines)
- English (Nigeria)
- Deutsch
- Español (España)
- Español (México)
- Français
- Italiano
- Nederlands
- Português (Portugal)
- Polski
- Português (Brasil)
- Русский
- Türkçe
- العربية
- Ελληνικά
- Svenska
- Suomi
- עברית
- 日本語
- 한국어
- 简体中文
- 繁體中文
- Bahasa Indonesia
- Bahasa Melayu
- ไทย
- Tiếng Việt
- हिंदी
A Look At April's National Activity Index
Published 05/20/2013, 10:21 AM
Updated 07/09/2023, 06:31 AM
A Look At April's National Activity Index
3rd party Ad. Not an offer or recommendation by Investing.com. See disclosure here or
remove ads
.
Latest comments
Install Our App
Risk Disclosure: Trading in financial instruments and/or cryptocurrencies involves high risks including the risk of losing some, or all, of your investment amount, and may not be suitable for all investors. Prices of cryptocurrencies are extremely volatile and may be affected by external factors such as financial, regulatory or political events. Trading on margin increases the financial risks.
Before deciding to trade in financial instrument or cryptocurrencies you should be fully informed of the risks and costs associated with trading the financial markets, carefully consider your investment objectives, level of experience, and risk appetite, and seek professional advice where needed.
Fusion Media would like to remind you that the data contained in this website is not necessarily real-time nor accurate. The data and prices on the website are not necessarily provided by any market or exchange, but may be provided by market makers, and so prices may not be accurate and may differ from the actual price at any given market, meaning prices are indicative and not appropriate for trading purposes. Fusion Media and any provider of the data contained in this website will not accept liability for any loss or damage as a result of your trading, or your reliance on the information contained within this website.
It is prohibited to use, store, reproduce, display, modify, transmit or distribute the data contained in this website without the explicit prior written permission of Fusion Media and/or the data provider. All intellectual property rights are reserved by the providers and/or the exchange providing the data contained in this website.
Fusion Media may be compensated by the advertisers that appear on the website, based on your interaction with the advertisements or advertisers.
© 2007-2024 - Fusion Media Limited. All Rights Reserved.