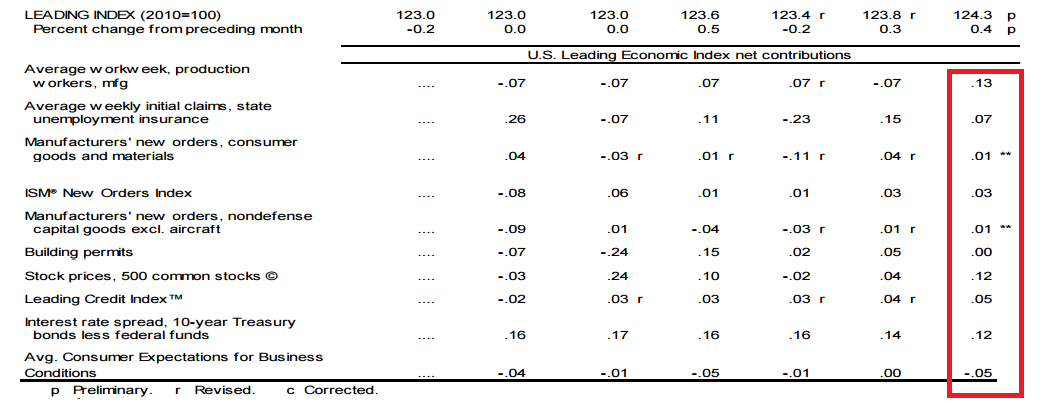
On Thursday, the Conference Board released the latest leading and coincident indicators. The LEIs increased .4% M/M and 1.1% on a rolling, 6-month basis. This is the strongest gain they’re had in 7 months. The CEIs also increased .4% M/M, while rising .7% on a rolling, 6-month basis. The breadth of the gain of each indicator’s components was very strong: 9/10 LEIs rose and all of the CEIs increased:

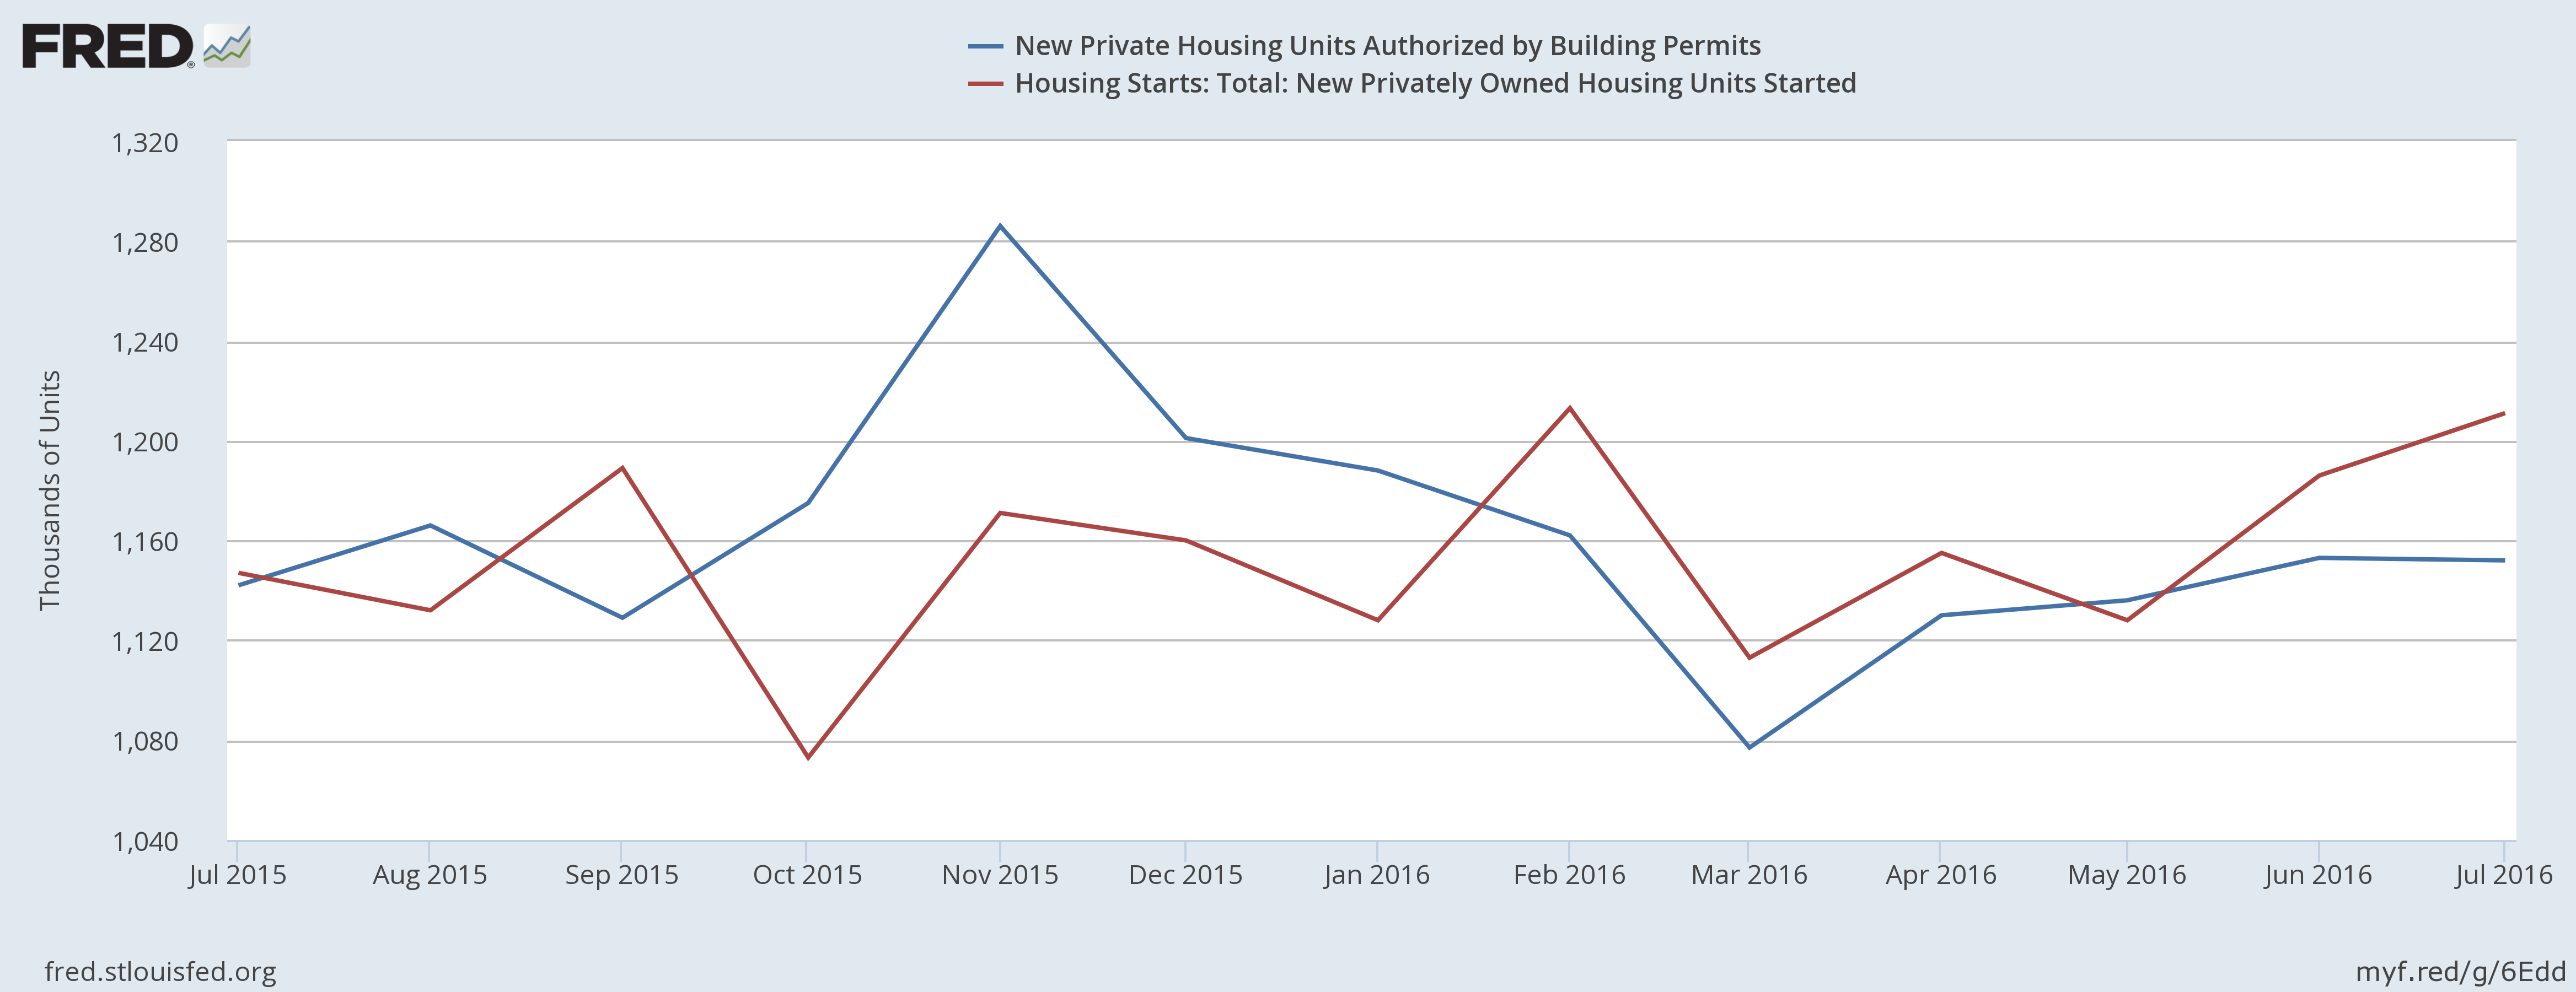
Housing news was positive. Building permits declined a slight .1% M/M, but increased .9% Y/Y. Starts were far more bullish: they increased 2.1% M/M and 5.6% Y/Y. But as the following chart illustrates, permits and starts have moved sideways for the last year:
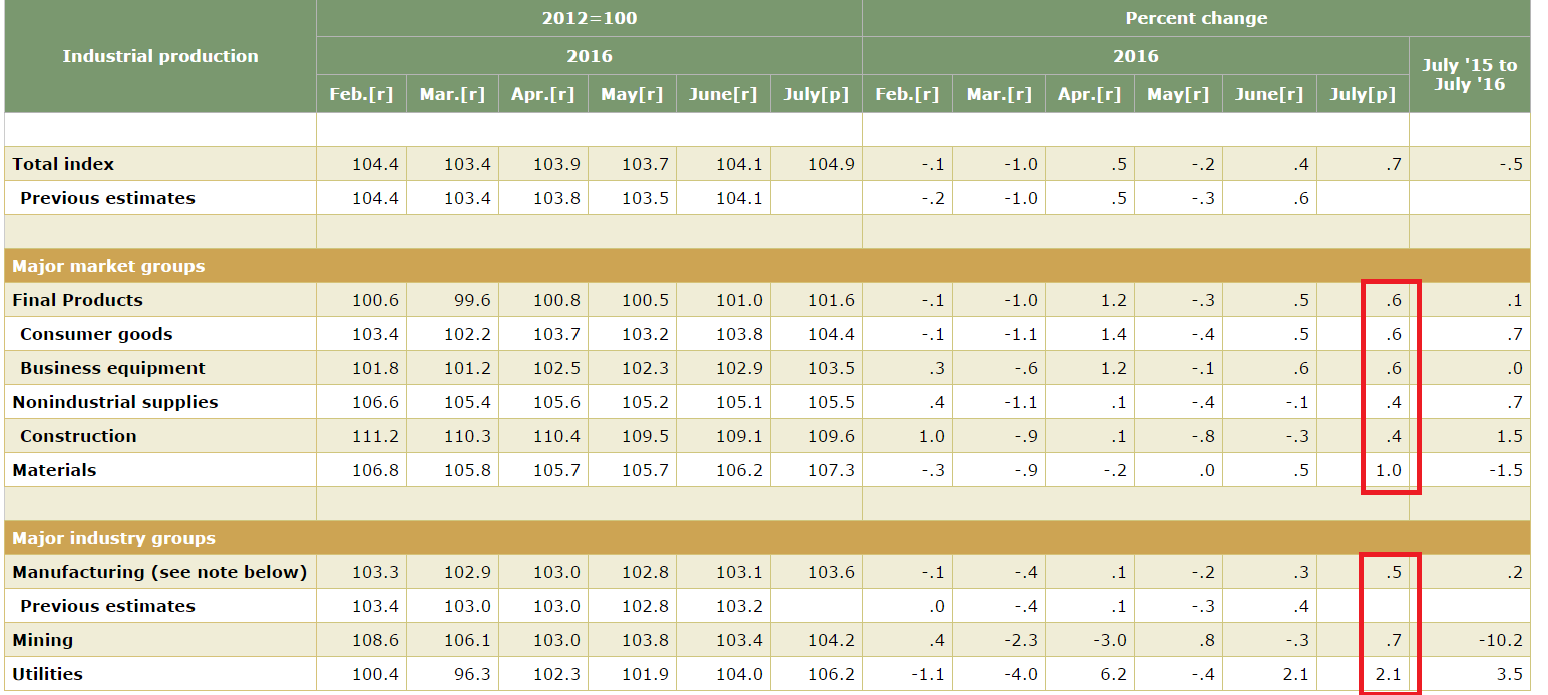
Industrial production, which is one of 4 coincident indicators, rose a strong .7%. This was the second consecutive increase and the 3 in the last 6 months. All market and industry groups rose -- including mining, which has been a prominent drag on this data series:
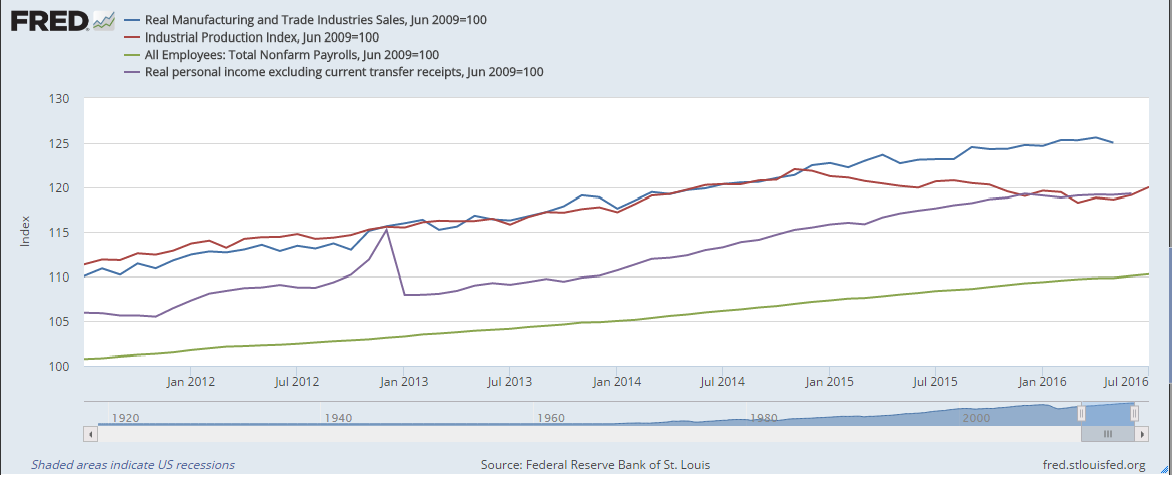
The following chart from the FRED system places the IP number into context with the other 4 primary coincident indicators, showing an economy that is expanding moderately:
Economic Conclusion: this was a strong week for economic news. The LEIs and CEIs, which not only summarize numerous key data points but also have a history of being very accurate, each printed strong headline numbers supported by broad-based gains of individual components. Although building permits and housing starts are moving sideways, they still point to a solid housing recovery. And the .7% gain in industrial production was its strongest gain in 7 months, also indicating that the negative impact of the oil market slowdown is waning. All the reported data pointed towards continued expansion.
Market Analysis: The markets have recently rallied above previous highs, thanks to a fairly decent earnings and revenue numbers (see here and here). But the 2Q “strength” is relative; in reality, the numbers are “less bad” than anticipated. The slightly positive earnings season explains recent market gains: the SPYs have advanced above recent technical resistance at the 217.5 level, consolidating gains slightly above that level. The QQQs have made similar upward progress.
But the weekly SPY (NYSE:SPY) chart foreshadows a slowing advance:
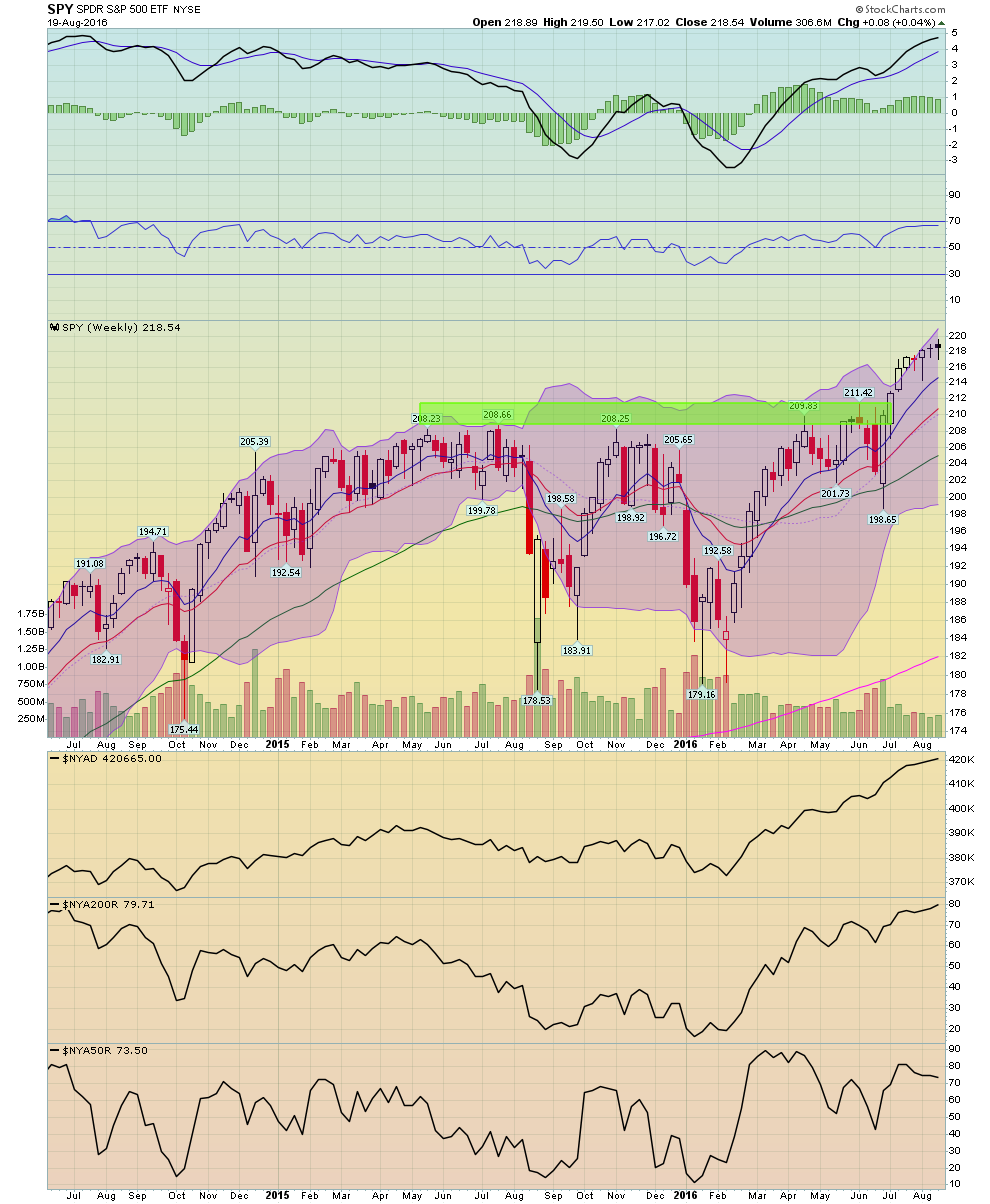
Prices have moved through the 210-212 area that provided resistance during 2015. But the recent advance has stretched technical indicators: momentum is near multi-year highs; the number of stocks about their respective 200-day EMA is greater than 80% while the number of stocks above their respective 50-day EMA is in the lower 70s (The same indicators for the Nasdaq are also high). These indicators show a market that is already stretched to the upside with very little additional room to advance.
Ultimately, we’re back where we started at the beginning of 2Q16 earnings season: the market needs more revenue growth to meaningfully move higher. And for that, we need to wait for third-quarter earnings season.
