
And they say Twitter (Twitter Inc (NYSE:TWTR)) has no value.
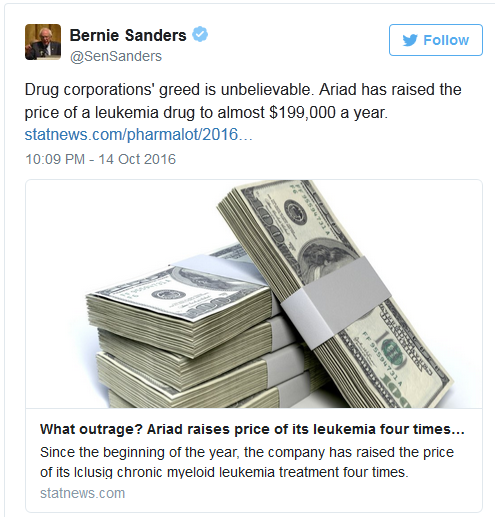
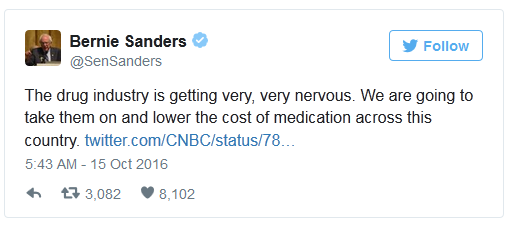
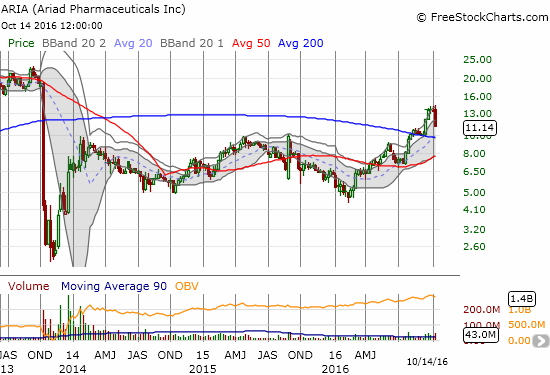
On October 14th, Bernie Sanders was given credit for taking down the shares of Ariad Pharmaceuticals (NASDAQ:ARIA) using the power of Twitter. ARIA fell 14.8% on the day on a 260% increase in trading volume relative to the 90-day moving average. ARIA is a stock still trying to recover from a massive plunge in 2013. Year-to-date ARIA is still up a hefty 78.2%.
Ariad Pharmaceuticals (ARIA) broke out in 2016 from a multi-year trading range. The move looked like it could finally propel ARIA into reversing its massive loss from 2013. At least partially thanks to Senator Sanders, ARIA looks more likely to reverse its 2016 breakout first.
ARIA has 18.4% of its float sold short (according to Yahoo) Finance), so Sanders threw a live stick of dynamite into the fray.
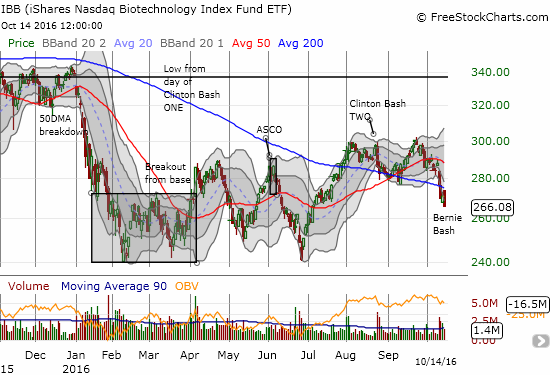
This episode was another reminder of the increasing pressure being brought to bear on drug companies and the prices of their drugs and remedies. Accordingly, the news seemed to take down the entire sector. ARIA is not a top 10 holding in IBB, yet iShares Nasdaq Biotechnology (NASDAQ:IBB) fell 1.9% on a day where the NASDAQ first gapped up and then ended the day flat.
The selling in IBB created a doubly bearish move. Not only did IBB confirm resistance at its declining 200-day moving average (DMA), but also IBB printed a bearish engulfing pattern. This pattern signals a top or a continuation of a bearish trend by opening higher than the previous day’s intraday high and closing lower than the previous day’s intraday low. This move takes on extra bearish significance given the confirmed 50DMA breakdown from September and the 200DMA breakdown two trading days prior. Moreover, Hillary Clinton seems to have helped IBB print a double bottom at the recent highs.
iShares Nasdaq Biotechnology (IBB) breaks down.
The only good news for IBB is that trading volume declined consistently as the week of selling wore on. So, it is possible the bearish pressure is starting to wane. Time will tell and technicals might offer clues to what is next.
For now, the trade on IBB is relatively simple:
- Fade rallies as long as it trades below 200DMA resistance,
- Buy on a close above 200DMA resistance, and/or
- Try for a buy on a retest of 2016 lows.
Each of these trades provides natural stop loss points: 1) above the 200DMA, 2) below the 200DMA, 3) a breakdown below the 2016 lows.
I fully expect #1 to dominate the IBB trading strategy all the way to a retest of the 2016 lows and then provide a lower risk and better reward buying opportunity in scenario #3. The pressure of the election cycle is on full throttle and bashing drug companies which have become perfect targets with nary a defender in site.
Full disclosure: short TWTR put options, long TWTR call options

