After a brief respite during December and January, the markets advance in February has now reconfirmed the bullish trend. Buy signals are back in place and the recent moves to fully increase exposure in the portfolio model in advance of the recent breakout are performing well.
Importantly, just because I am discussing the resumption of the “bullish” trend in the market, it does NOT mean there is NO RISK of a meaningful and crippling mean reverting event in the near future.
You should remember that when you are investing there is NO SUCH THING as LONG TERM. All you have as an investor is the capital that you are speculating with today and the time you have until you need it. Investors have lost almost 6-years of their investment time horizon simply “getting back to even” following the last market decline. While the capital has been recovered, the time lost can never be. This is why so many retirees are now unprepared to retire which also explains why the number of individuals over the age of 64 still working is at the highest level on record.
When you are told that “you are a long-term investor” and therefore you should “hold” investments for an indefinite period, it suggests one of two things: 1) It is due to laziness; or 2) there is no real understanding of how to invest or control risk.
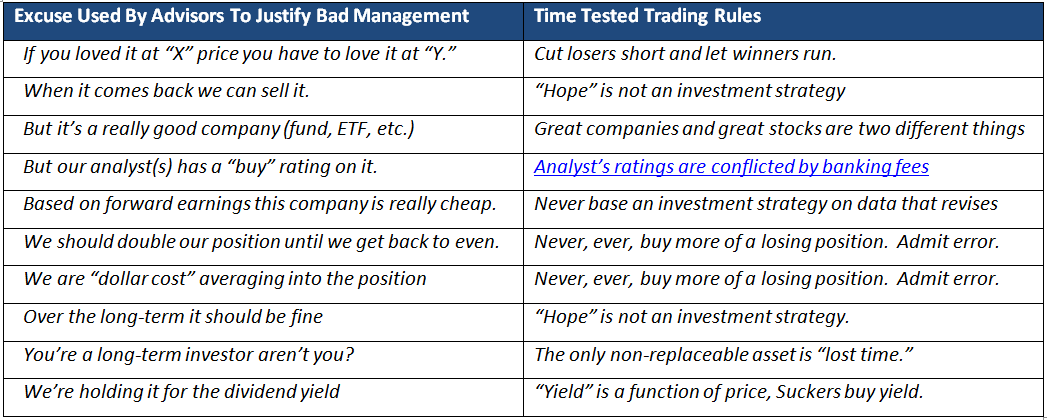
Here are the top 10 “excuses” used to justify bad investment management versus time-tested risk management investing rules:
For more on this subject, please read “10 Investment Rules To Live By”
Okay, with that said, let’s take a look at the cyclical bull-market trend for currently invested portfolios. (I say "currently invested portfolios" because it is an entirely different discussion for portfolios primarily in cash.)
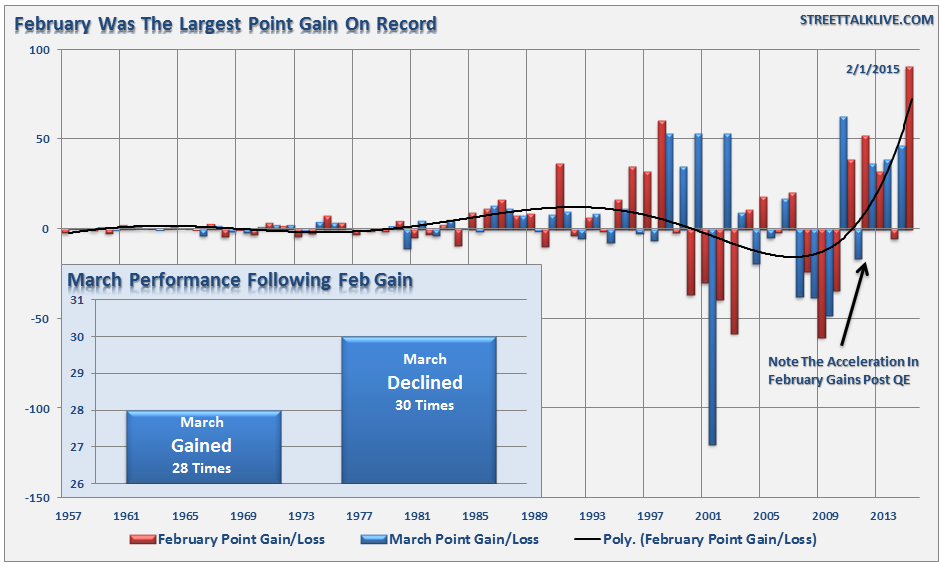
We first need to review the market action during February. The past month saw the S&P 500 rack up its biggest Februrary point gain for in history going back to 1957. The chart below shows the month net point performance of February and March of each year.
There are a couple of notable points. First, historically speaking, the month of February has tended to be one of the weaker performing months of the year. However, since the Federal Reserve began their liquidity operations, and really Central Banks globally, following the financial crisis there has been a massive ramp in monthly performance.
Secondly, besides February being the single biggest monthly point gainer in history, what does that tell us about what to expect in March? When we look at the data, we find that the month of March is technically a “crap shoot” for outcomes. Since 1957, March has had gains 28 times following a February gain and declined 30 times. That is only slightly less than a 50/50 chance that March will end higher than where it begins.
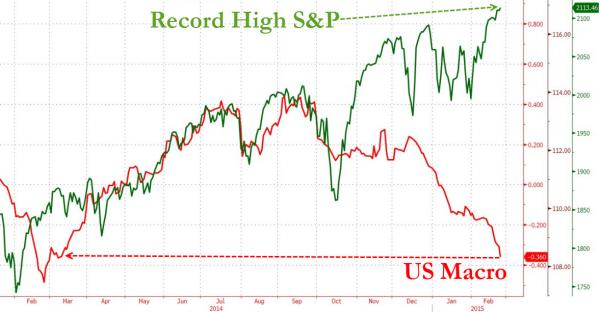
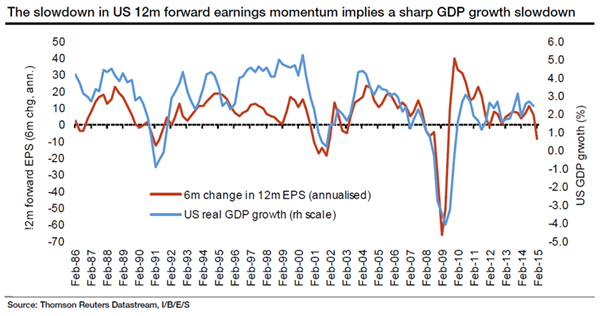
Mind you, the advance is primarily based on “hope” of the ECB’s upcoming QE program that begins next month. The market is completely dismissing the slowing of the U.S. economy and earnings which is creating a massive divergence between prices and underlying fundamentals.
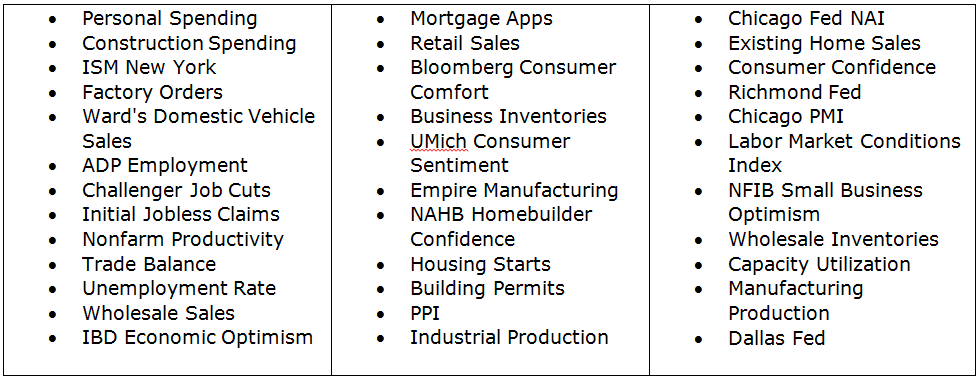
In the month of February alone here is a list of the major economic reports that were missed.
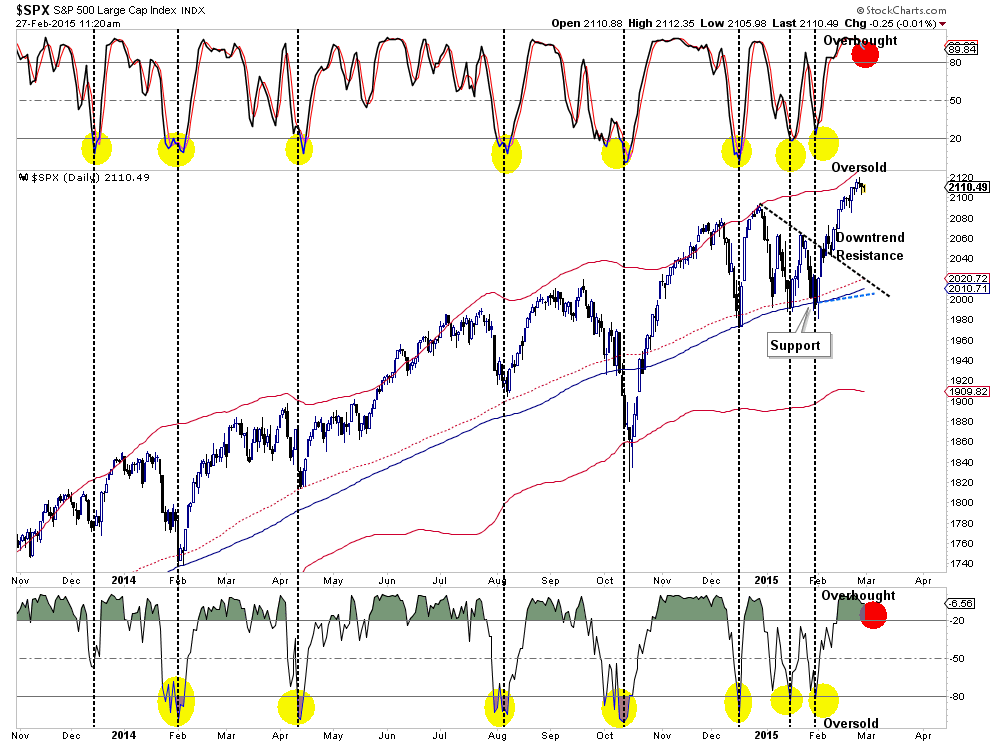
Furthermore, despite the slowing of the economy, markets surged to all-time highs. This puts prices once again into extremely overbought territory with little upside remaining.
When the market broke out of the “down trend” that had been established from the December highs, I recommended taking portfolio exposure back to full weightings and increasing exposure to mid-capitalization stocks which had begun to outperform large capitalization holdings. This turned out to be salient advice as that outperformance has continued as of late.
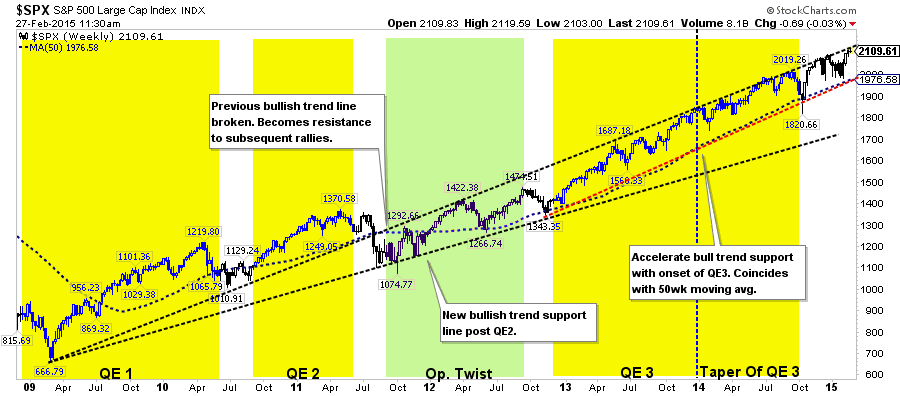
The next chart shows the weekly bullish trend of the S&P 500 with liquidity interventions overlaid.
Notice that since the end of QE2 the market has remained confined to a very narrow rising trend between the resistance of the broken bull trend line in 2011 and the bullish support trend from 2009. Furthermore, the bullish trend support line has accelerated (dashed red line) and is following the 50-week moving average. That 50-week moving average has now become very critical support, a break of which would suggest a bigger correction is in the making.
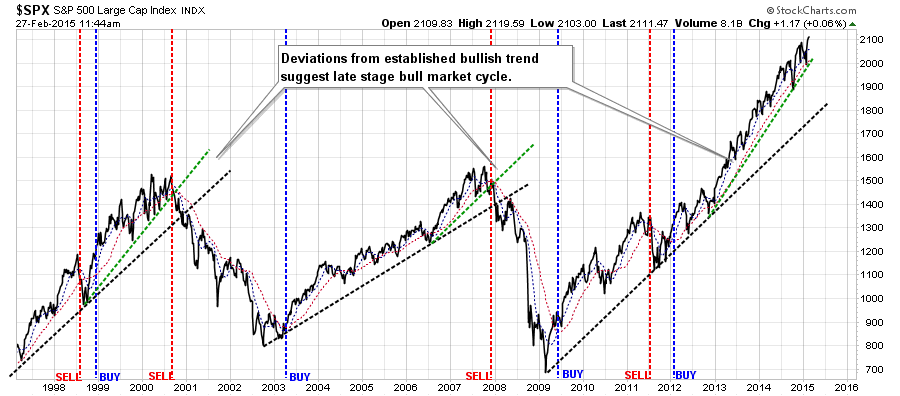
Finally, it is worth noting that the acceleration of the bull trend support is something that has only been seen in late stage bull market cycles as shown below.
While this doesn’t suggest that the markets are about to “crash,” it does suggest that the risk/reward of jumping into the financial markets today is heavily weighted against investors.
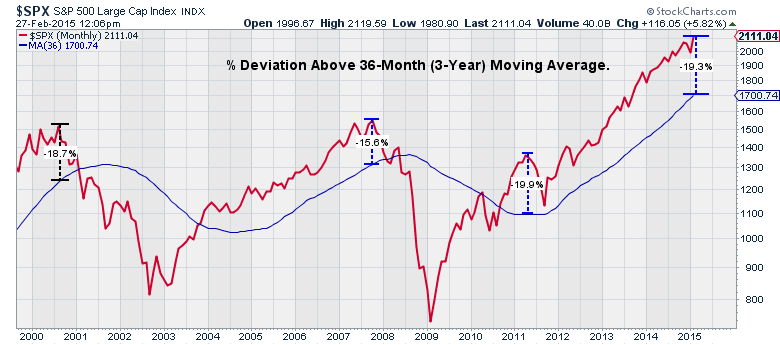
It is also worth noting that the S&P 500 is currently 19.3% above its 3-year monthly moving average which is the second largest deviation in price since the turn of the century.
Exuberance In Pictures
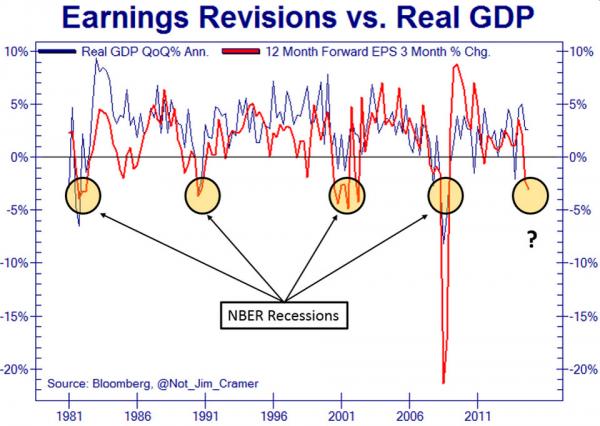
As I discussed above there is a detachment between the underlying fundamentals and the markets. Take a look at the following charts and decide for yourself. (Charts via ZeroHedge)
It should be obvious that since the markets are ultimately a reflection of underlying economic activity, eventually the drive higher in prices will end. However, in the short-term, the markets can and do become propelled by emotional “herding” as investors chase stocks higher. This always ends badly for those that fail to pay attention to the broader picture and this time will not be any different.
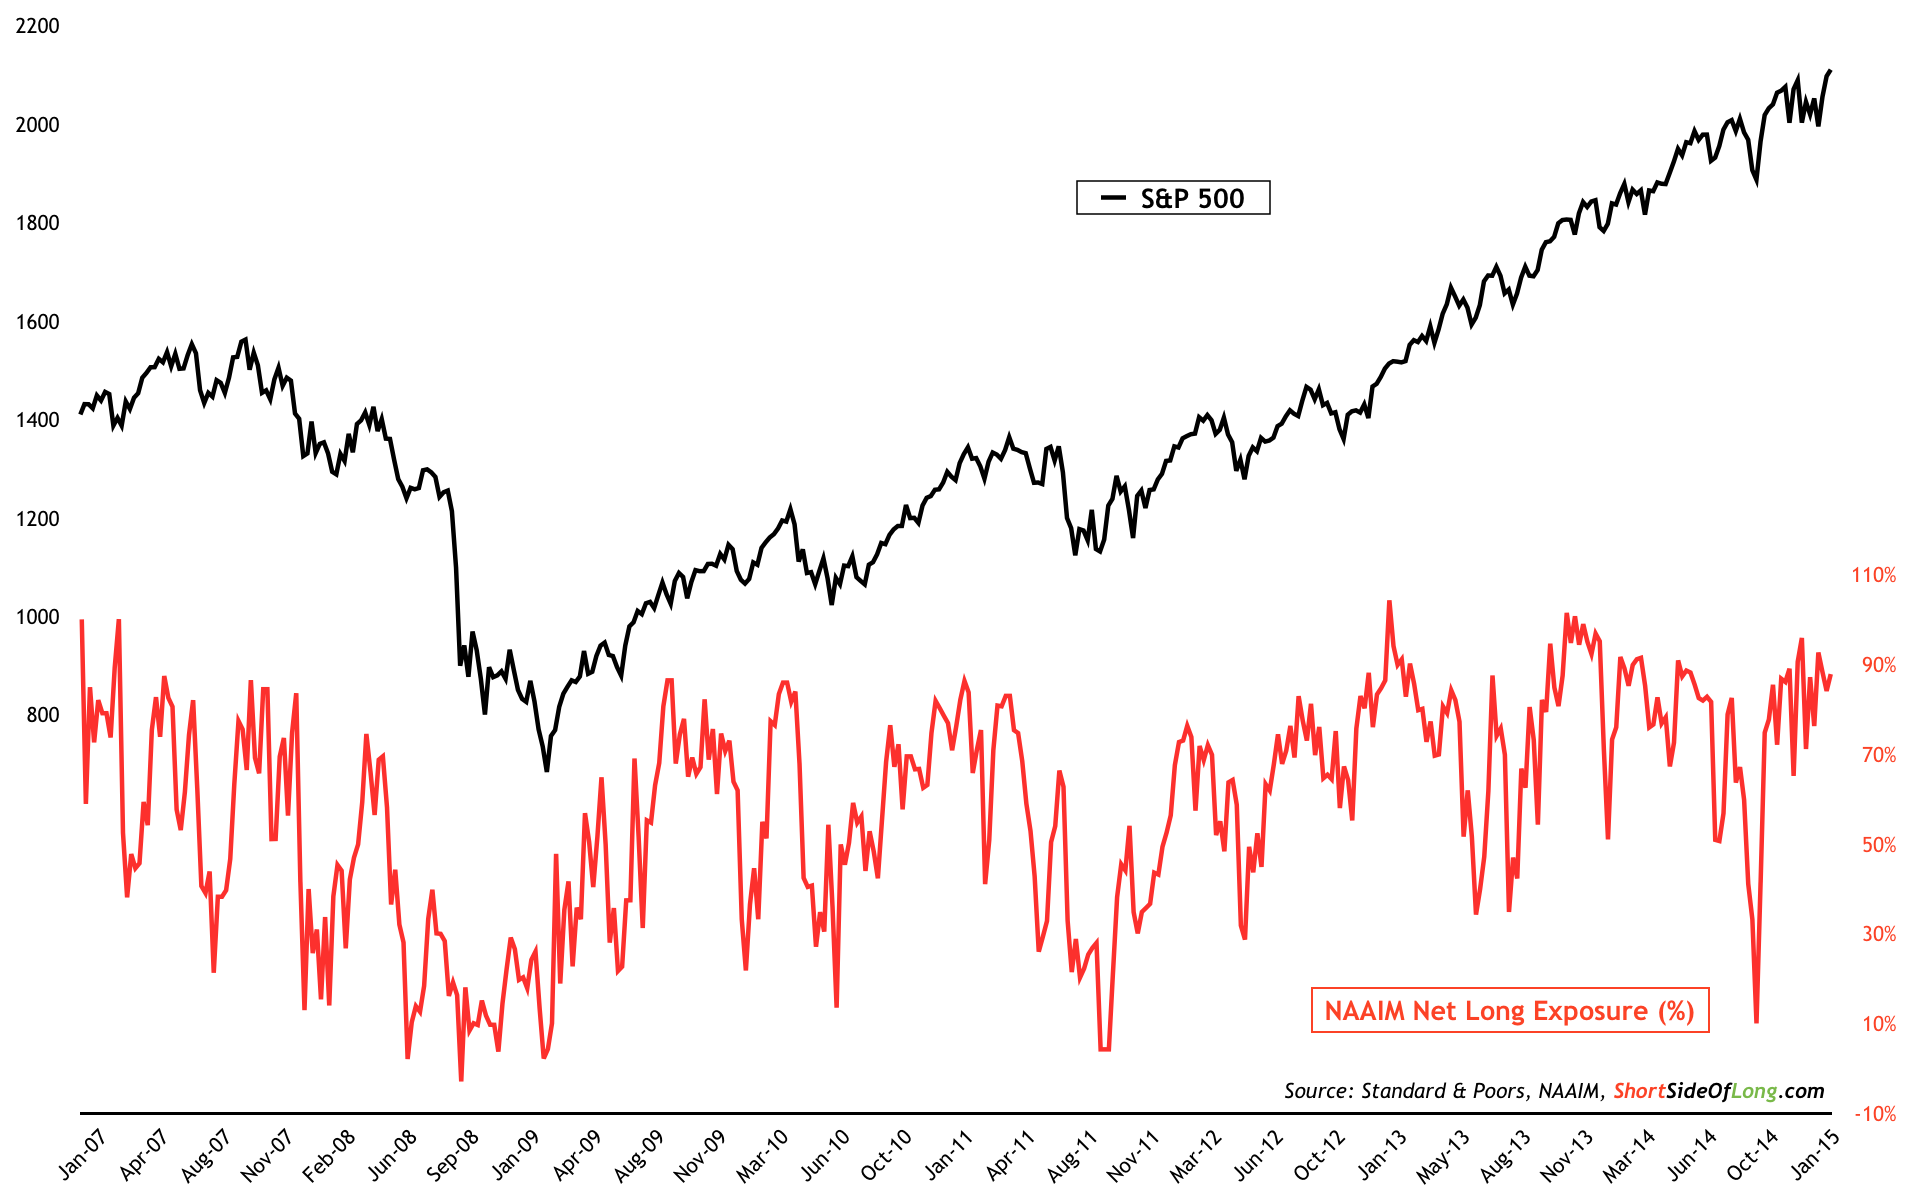
Fund Managers Are VERY Bullish
I just wanted to close this week’s missive with the following from “The Short Side Of Long” Blog
“Contrarian investors should start to pay attention. Over the last several months, NAAIM survey has been showing signs of extremely optimistic investor behavior and it could be a dangerous signal. Since November of 2014, the average weekly reading for the survey was 83% net long, with the lowest level recorded at 65% (refer to Chart 1). This is a far cry from the levels seen during the recent intermediate bottom in October 2014, as exposure fell to only 10% net long."
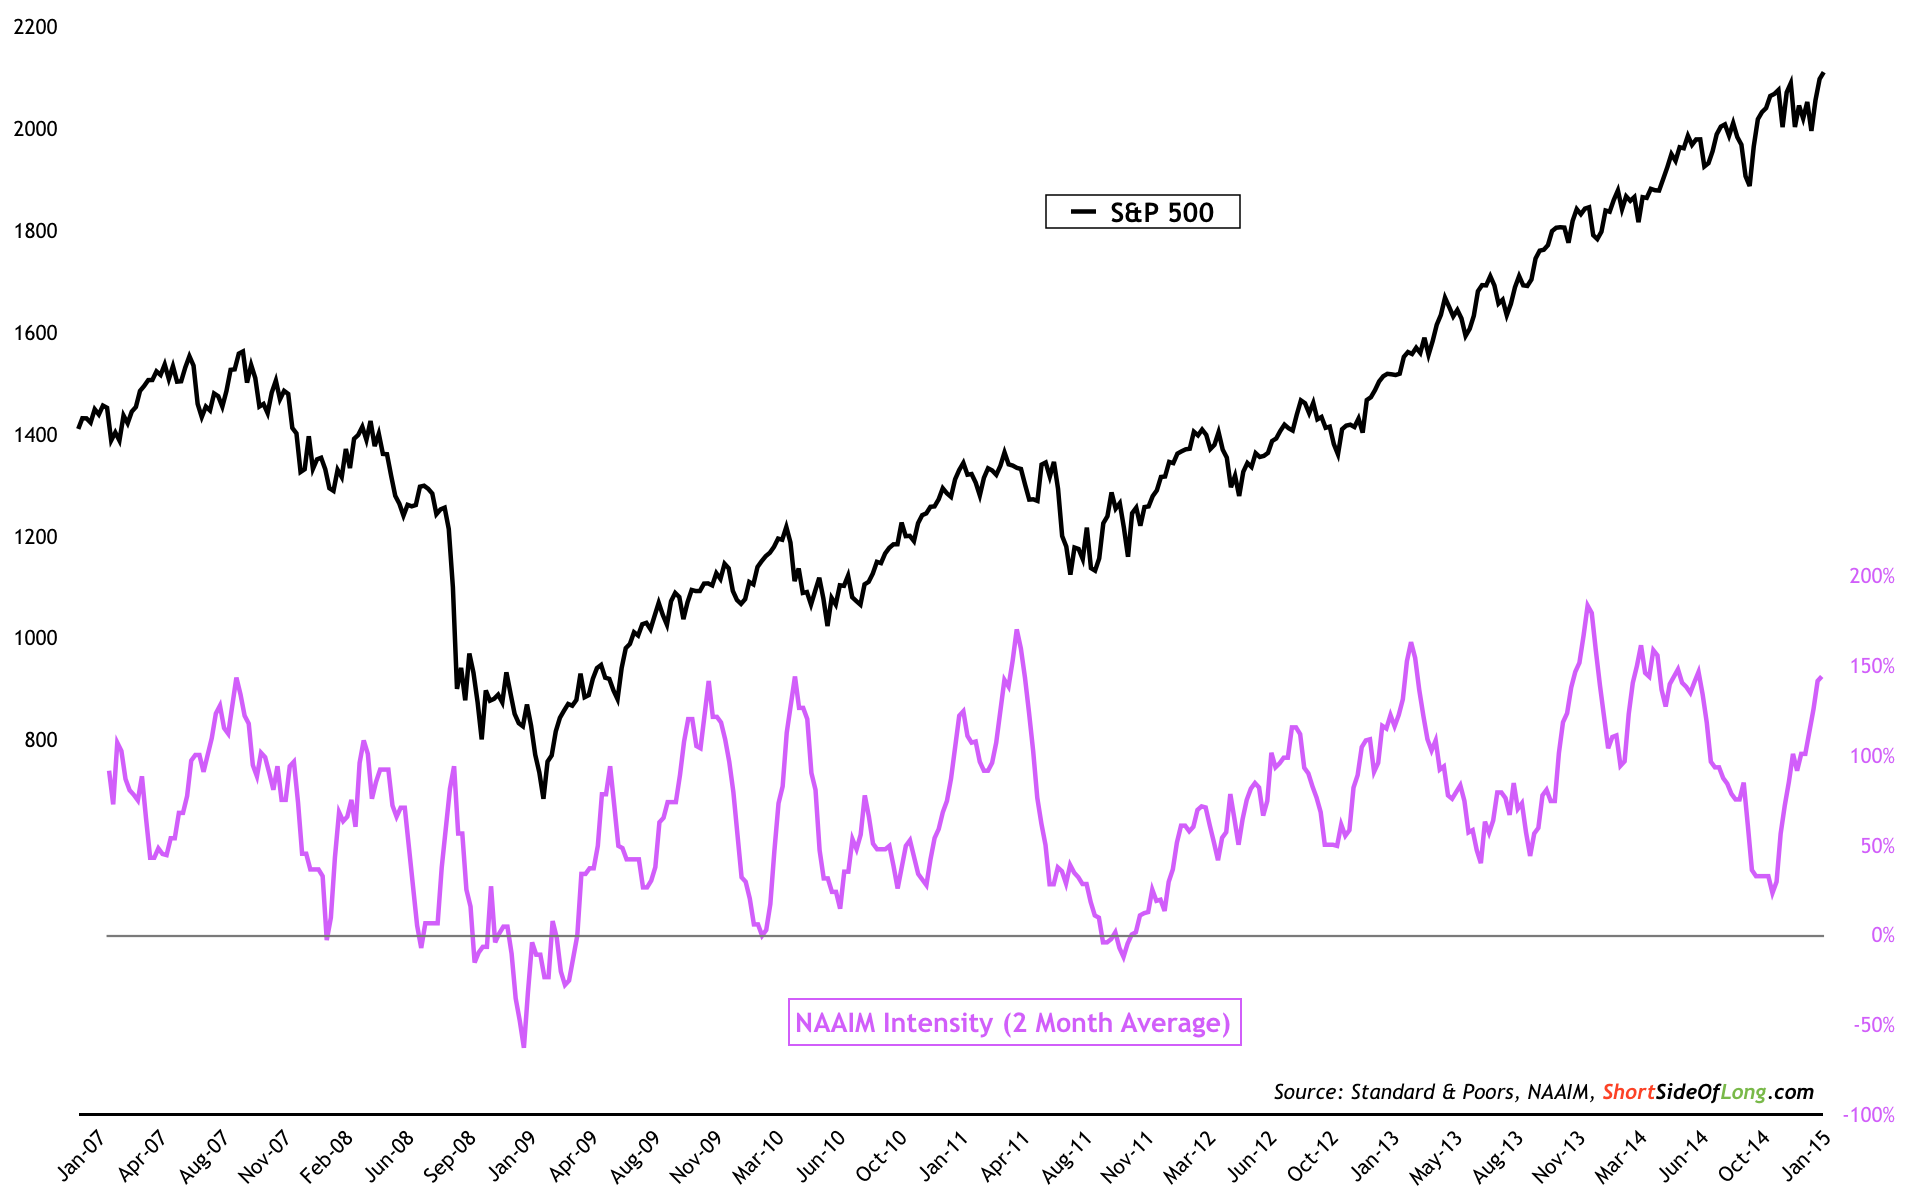
"Furthermore, the difference between the net long managers relative to those who are net short, has been skewed more and more towards the bullish side. This is especially true over the last month, where the intensity has averaged 200% - a maximum reading possible - signaling outright greed. This kind of persistent bullishness, usually but not always, results in a sharp and fast shake out."
"For those who are net long equities as of today, caution is advised!”
Remembering The Trend
In investing our job is to participate with the “trend” while it is rising. However, it is critically important that you remember that trends do go in two directions, and it is the completion of the full-market cycle that devastates the majority of investors.
Currently, the trend is bullish and there is no denying that. This is why the portfolio model remains fully allocated.
However, when that trend changes, so will the allocation model. This is what is called portfolio management. Will the changes always be 100% accurate? Of course, not. But in investing it is avoiding the “strike outs” that wins the game. That is why we continue to pay very close attention to the pitches coming at us. There will be a point where it will be time to stop swinging.

