A Case Study of the Japanese Yen
When you examine Japanese culture, you find that it values many of the qualities that one needs in order to become a successful trader. The Japanese people are very dedicated and hard-working, and they are willing to learn and invest in themselves. Additionally, they are not overly worried about short-term gains. Instead, they are more interested in attaining long-term success. In the trading world, Japanese traders are highly respected because of their efficiency, discipline, and willingness to work as hard as needed in order to succeed. If one wants to make a profit as a trader, he or she should take note of the above-mentioned qualities found in Japanese culture and remember that the most successful traders are those who work hard, remain disciplined, invest in themselves, and stay focused on long-term rather than short-term gains.
In the same way that Japanese culture is different than Western culture, the Japanese yen has a “personality” that is distinct from other world currencies. The yen very much follows its own rhythm, and its value moves based on specific events. Just like other currency pairs, USD/JPY also has its own particularities. This currency pair’s unique behavior is largely driven by how Japanese traders are trading.
Since current Prime Minister Shinzō Abe took office in 2012, the Japanese stock market has performed quite well. The market’s performance has attracted many Japanese investors who finally saw some investment opportunities after nearly two slow decades. This has led to a surge in the number of Japanese traders, especially female traders, who now represent more than 25 percent of the Japanese retail forex market. Generally speaking, most Japanese traders are very sophisticated and well-informed about the latest developments in the forex market. They are also very cautious about which broker they choose to work with.
The influx of new Japanese traders has also contributed to the weakening of the Japanese yen over the last three years. Of course, the main driver behind the yen devaluation was the Bank of Japan’s (BOJ) monetary policy and its aggressive easing program, which has sent the USD/JPY toward a 13-year high. Going forward, we’re going to look at some of the drivers behind the weakening of Japanese yen, and we’ll also try to look at what lies ahead of us.
Japanese Yen: A Measure of Risk Sentiment
The Japanese yen has taken up the role of a risk barometer not just in the FX market but in all major asset classes. This is because whenever the market goes through a period of crisis or financial instability, the Japanese yen is perceived as a safe-haven currency. In certain risk-aversion scenarios, the Japanese yen gets stronger, which often means USD/JPY is selling very aggressively.
The recent technical breakout in the equity market is suggesting a much stronger push and a greater move toward risk aversion. It’s important to understand the severity of risk aversion because a very weak form of it is only going to impact certain things under certain circumstances. For example, we can see equities dropping, but if none of the risk aversion actually spills over into the FX market, the risk aversion will be weak. When the market is experiencing strong risk aversion, however, the entire financial system can be affected. In the FX market, we will quickly see each currency realign to its traditional risk-on, risk-off type of bearing. Because of this, the FX bearings typically provide some of the best measures of risk-aversion.
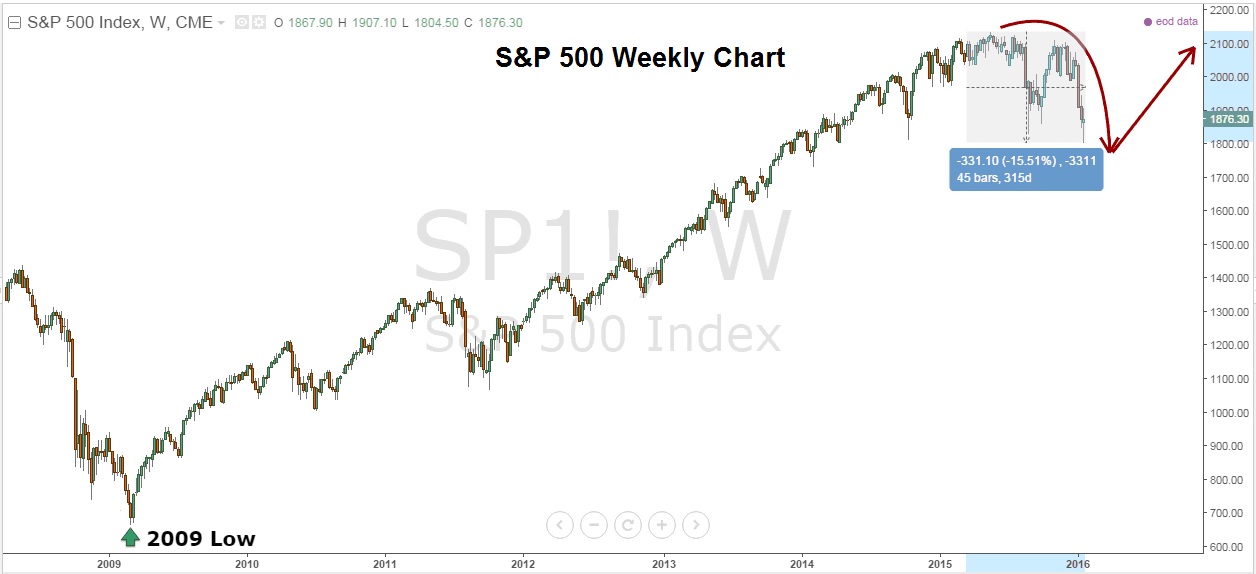
Figure 1: S&P 500 Weekly Chart
When we look at the S&P 500, we can see we have experienced a significant pullback from record highs (see Figure 1). In the context of the bigger picture, however, we really haven’t reversed much of the advance from the 2009 lows. When we get to a greater intensity of risk aversion, we need to see consistent selling pressure across assets. If we look at USD/JPY, we can see that it’s lagging behind on this front, and it may provide another great opportunity to buy the USD/JPY and align oneself in the direction of the dominant bullish trend.
Japanese Yen Carry Trade
The US dollar is known as the world’s reserve currency, and its liquidity gives it a strong safe-haven appeal. It is also the most used reserve currency for transactions around the world. Because of its wide-spread use, the US dollar is a currency that investors trust, and they turn to it during times of uncertainty. This is why it is considered a safe-haven currency. The Japanese yen, on the other hand, is something of a carry currency that traders use to purchase bonds that carry higher interest rates and offer the potential for more profit.
Historically, the yen crosses have been the primary currency that the FX world has used for carry trade, especially the short-side of the carry trade. This means that traders often short the yen and buy other currencies. If there is significant appetite for risk, however, traders long the Yen crosses and then unwind those positions when risk aversion returns. When people get out of the carry trade and unwind yen crosses, these pairs go down in risk aversion. This does not occur because people are fleeing to the Japanese yen, though. It’s because they are taking off existing positions. They were long USD/JPY in an effort to collect returns on the yield differentials. This was their risk trade to go long in a risk-on environment, and in a risk-off environment they have to take the risky trade off. When we take that trade off, USD/JPY drops. The drop occurs because traders are neutralizing or offsetting their existing position not because they are necessarily fleeing to the Japanese yen.
In contrast, the US dollar is a different concept in that it is a safe haven that funds turn to in extreme conditions. This helps advance the US dollar, which has performed quite well in recent years. The dollar’s performance is mainly due to its positive interest rate forecast rather than its safe-haven status, however. That safe-haven appeal comes into play only during times of uncertainty, when people are likely to buy the US dollar. If a certain level of uncertainty comes into play and people began to turn to the US dollar, we are going to see some imbalance in USD/JPY, and the liquidity resulting from so much capital going to the US dollar will drive USD/JPY higher.
In order to properly implement the carry trade, you need more than just the right currency pair; you also need the right broker. Each forex broker will charge you differently when it comes to the interest rate differential. So, in order to avoid being scammed, it’s always good to do your homework. Currently, there are many resources to help traders learn more about the market, including the latest forex scams.
The Fundamental Case for USD/JPY
There are two main reasons USD/JPY will be supported in the coming months. First, the higher US rates are acting as a transmission mechanism to further strengthen the US dollar. Secondly, certain domestic factors in Japan should act as the transmission mechanism that will further the yen’s weakness. The fundamental case is pretty strong for more upside in USD/JPY because even in the absence of just one of the two factors, USD/JPY will still be supported. The key factor behind the impressive USD/JPY rally that started in 2012 has been the BOJ’s aggressive monetary easing, which has helped pump trillions of Yen into the system. The BOJ’s monetary policy is quite different than that of the Federal Reserve, which has started to normalize interest rates. This divergence in monetary policies between the two banks will continue to serve as a dominant driver of the market.
During his recent speech in parliament, BOJ Governor Haruhiko Kuroda sent a clear message that the BOJ will adjust monetary policy if prices deviate and threaten its 2 percent inflation target. This likely means more qualitative easing (QE) and assures that USD/JPY will not drop much before the BOJ steps in. Governor Kuroda’s message also further strengthens the case for a bullish USD/JPY scenario. After nearly two lost decades in Japan, the fear of deflation is still persistent everywhere, and it’s likely to prompt a response from the BOJ if both the equity market and USD/JPY drops.
Technical Case for USD/JPY
The USD/JPY long-term technical pattern is very clear. With a simple glance at a chart, we can see that we’re in a strong bullish trend, and momentum is moving to the upside. In order to understand why there is still the likelihood for more upside, we need to look at the bigger picture (see Figure 2). By examining the monthly chart, we can see that we managed to break a long-term trend line in 2014. But, even more importantly, we also managed to break the high made in 2007 during the US subprime mortgage crisis. This break opened the door for or a retest of the 2002 highs near the big figure 135.00.
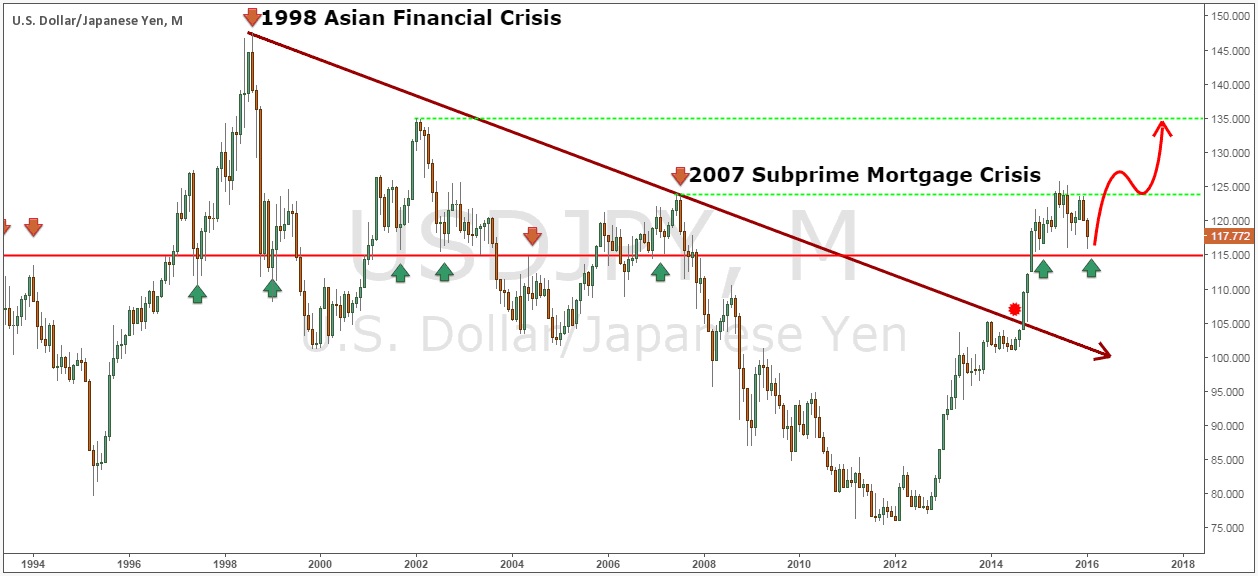
Figure 2: USD/JPY Monthly Chart
In short-term price action, the 115.00 pivot point and the big psychological number will be crucial in keeping the bullish case intact. It is important that we have a monthly close above the 115.00 figure because it will help preserve the view for more upside. The USD/JPY has spent most of the last year in a tight range that forms what looks like a bullish flag, which is a continuation pattern that signals there will be more upside for USD/JPY.
As we already discussed, the Japanese yen is a risk-off asset in the currency market. This means that the value of Japanese Yen goes up when the equity market experiences sell-off. A correlation between USD/JPY and the Nikkei 225 as risk assets means that they’re each possibly tied to a third item that is causing both currencies to move. In other words, they’re both being impacted and influenced by something else. It’s not that USD/JPY is causing equities to move nor is it Nikkei 225 causing USD/JPY to move. We can see the correlation between USD/JPY versus the Nikkei 225 (see Figure 3) and how it plays out in times of risk-aversion.
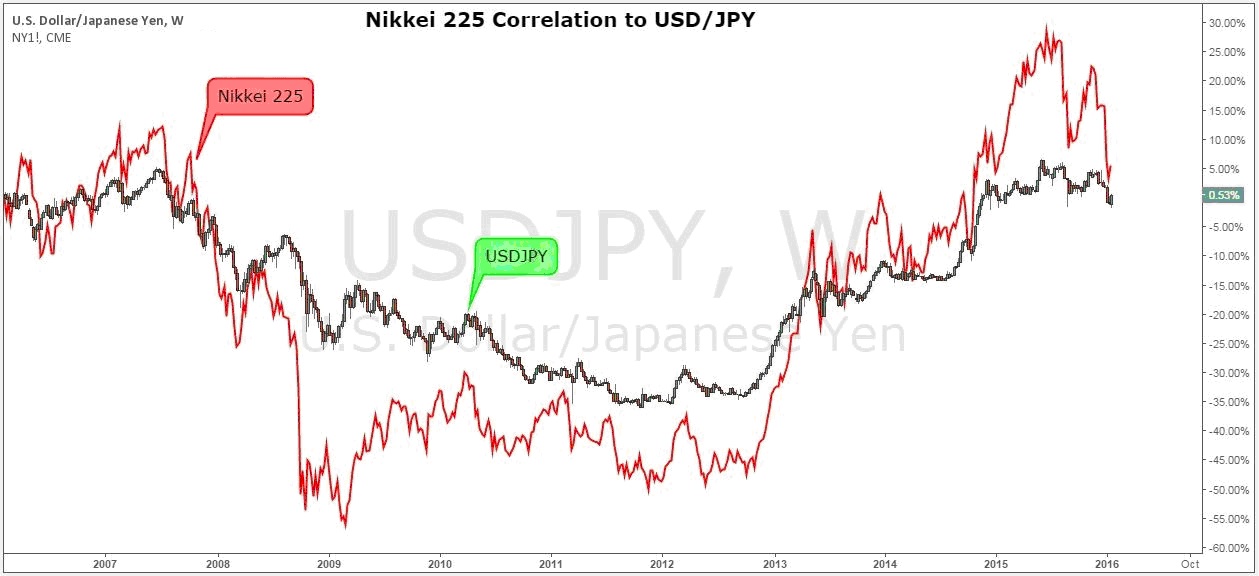
Figure 3: Nikkei 225 Correlation to USD/JPY
If there is such a high level of correlation between the Nikkei 225 and USD/JPY, we can take our analysis one step further and analyze the Nikkei 225 chart to find more clues that could help us foresee what could be the next phase for USD/JPY. By looking at the Nikkei 225 chart, we see that the long-term bullish trend has not been damaged. Despite the recent aggressive sell-off, we have only managed to retrace towards the 32.8 percent Fibonacci retracement (see Figure 4), which is evidence of a correction of the bigger cycles. These corrections are healthy because they help create a more balanced market. Otherwise we end up with a bubble, but that is not the case here.
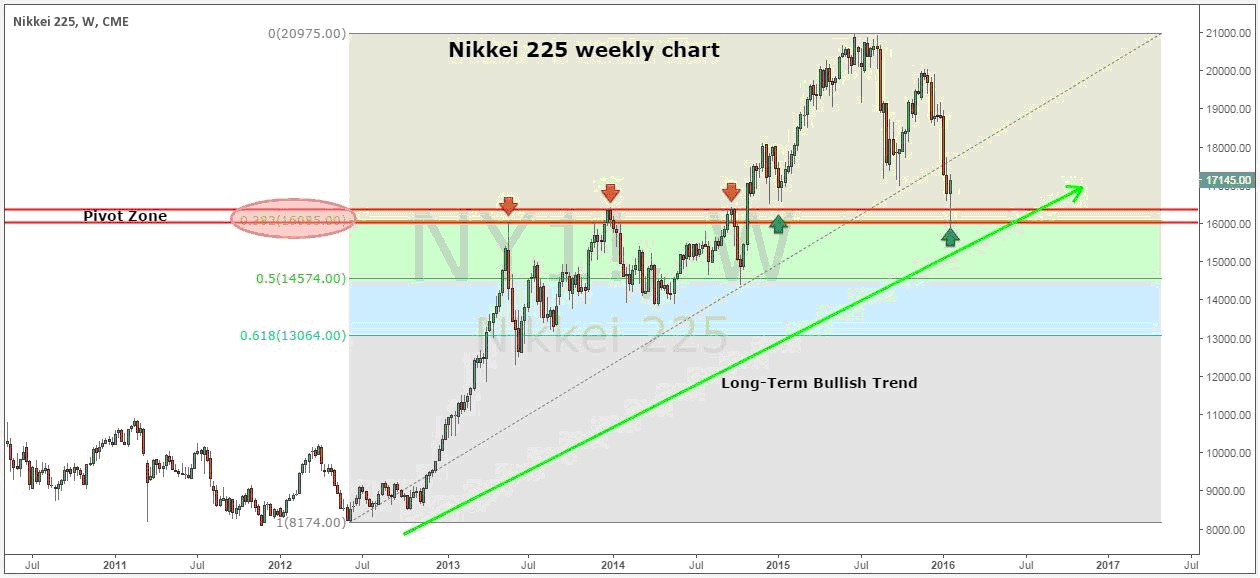
Figure 4: Nikkei 225 Weekly Chart
Not only have we retraced to the 38.2 percent Fibonacci retracement from the 2012 lows, we’re also retesting the 2013 highs, which is a great confluence area that can be marked as a pivot zone where current sell off can find support. This inflection zone needs to hold the price in order for the bullish case to remain in place. Otherwise, this could turn into a bearish trend, but that scenario is less likely. After nearly two lost decades in Japan, it’s hard to believe that this bullish trend will last only three years. Actually, there is a 12-year cycle from peak to trough in the Nikkei 225. By projecting this cycle from the 2012 low, it’s easy to understand why the current bullish trend has a lot more legs to the upside and a lot more time to develop in the coming years. But, as I mentioned earlier, these corrections are good for the market.
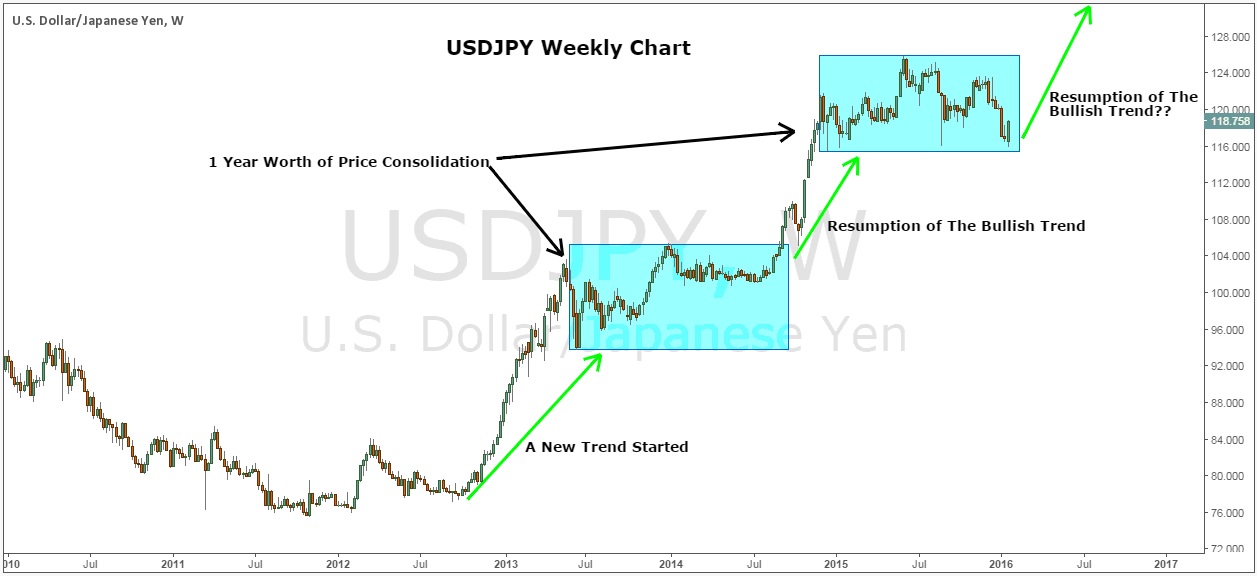
Figure 5: USD/JPY Weekly Chart
Looking at the short-term price structure in the USD/JPY, we can note that we have the same repetitive pattern, which is a fractal pattern that repeats itself. Since the start of this bullish cycle in 2012, we have had two instances (see Figure 5) of pauses in the trend. The first one was holding between the second half of 2013 all the way through the middle of 2014. That represents almost a year worth of price consolidation. The same pattern emerged in beginning of 2014, and time-wise it seems that this consolidation is almost done. So, it’s safe to assume that the bullish trend will resume sometime soon.
Conclusions: The Japanese yen is in kind of difficult position because it is common to experience a pause before a continuation to the downside. However, it is not a good time to just call a reversal because those fundamentals that have pushed down in terms of risk are well-suited and well-funded. There is good reason to suggest that we’re supposed to be in a more risk-adverse environment. So, expecting a rebound is perhaps reaching beyond what the fundamentals and the market can actually offer us.
Traders with a greater risk profile are not going to be too concerned, and they are most likely going to try to jump on the long USD/JPY trade right now. At this point, however, doing so could be a little bit risky because you’re not only picking direction you’re also choosing an activity level. Realistically speaking, if you’re going to move on both direction and momentum with no actual confirmation, you’re really stacking the odds against you. It is probably a better idea to be more defensive and wait for a technical breakout to the upside.
We have to be patient with this trade and wait to find out if we are going to finally see a long-term repositioning. If that is the case, then there is going to a great trading opportunity that will certainly be worth the wait. But, as we have discussed throughout this article, both the macro-fundamental data and the technical picture indicate that USD/JPY will experience more upside. In this case, we have to play aggressively, or we might miss the move while we wait for everything to align perfectly in our favor.
