On Friday, February 26th, the U.S. Department of Commerce’s Bureau of Economic Analysis reported revised GDP results for Q4 2015. The number went from a first estimate of 0.7% to 1.0% annualized. The Bureau of Economic Analysis declared “with this second estimate for the fourth quarter, the general picture of economic growth remains the same; private inventory investment decreased less than previously estimated.” Despite the pronouncement, financial markets acted as if material news had indeed occurred. The nudge upward in GDP was apparently enough to push rate expectations back into 2016 for the first time in February.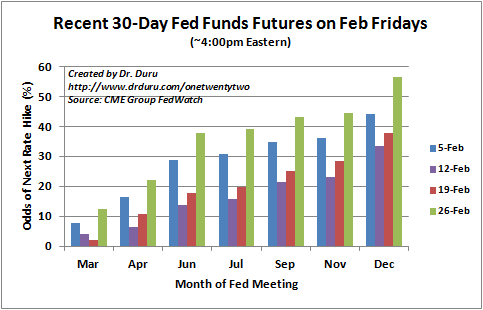
Until the 26th, February’s bets on the next rate hike were placed outside of 2016.
With bets on the next hike finally placed back in 2016, the U.S. dollar index (DXY0) responded with another surge toward resistance at its 50-day moving average (DMA). The index closed right at this critical line in the sand (two days earlier, the index stopped short before fading).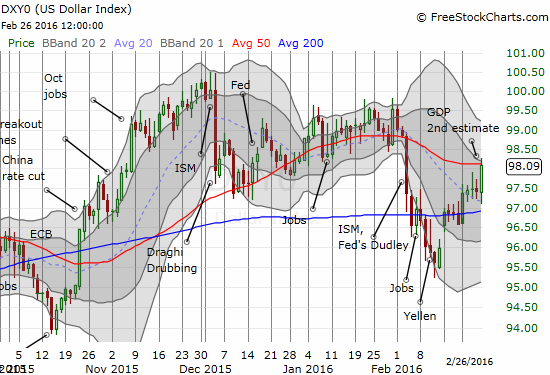
The U.S dollar index has essentially churned in a wide trading range for the past 4 months. The 50DMA is starting to look like a pivot.
Interest rates also ticked up (bond prices fell). However, iShares 20+ Year Treasury Bond (N:TLT) managed to hold its uptrend at the 20DMA.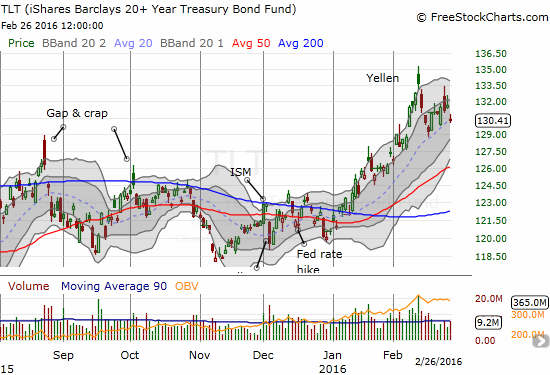
iShares 20+ Year Treasury Bond (TLT) was knocked down but held its 20DMA uptrend.
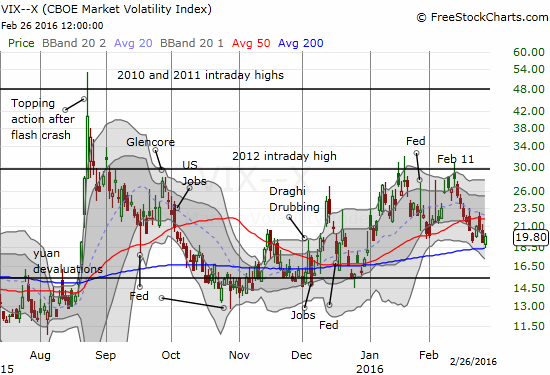
Most interesting were the prices of gold and silver. SPDR Gold Shares (N:GLD) opened marginally lower and dropped as far as $116 before buyers stepped in and took GLD back up. I can only assume a surge of interest in the volatility index, the VIX, helped lift GLD’s spirits.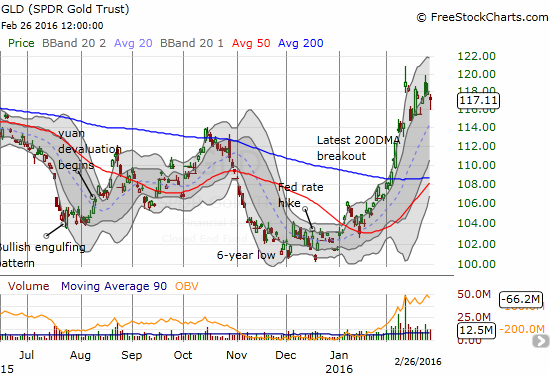
SPDR Gold Shares (GLD) shows resiliency on a day where rate expectations came back to life.
The volatility index bounces neatly off 200DMA support.
Silver was not nearly as lucky as gold. I decided to double down on some call options on iShares Silver Trust (N:SLV) despite the sudden end to its 200DMA breakout. I am now looking to the uptrending 50DMA to provide support.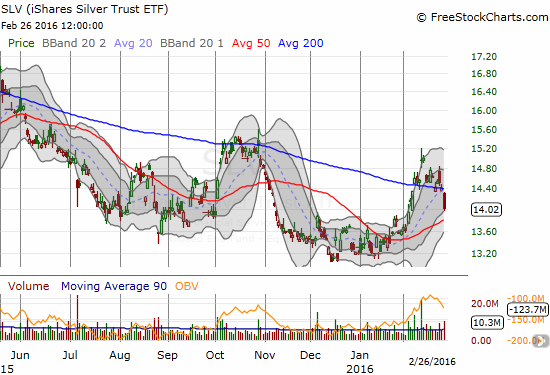
The 200DMA breakout for iShares Silver Trust (SLV) has come to a sudden and abrupt end.
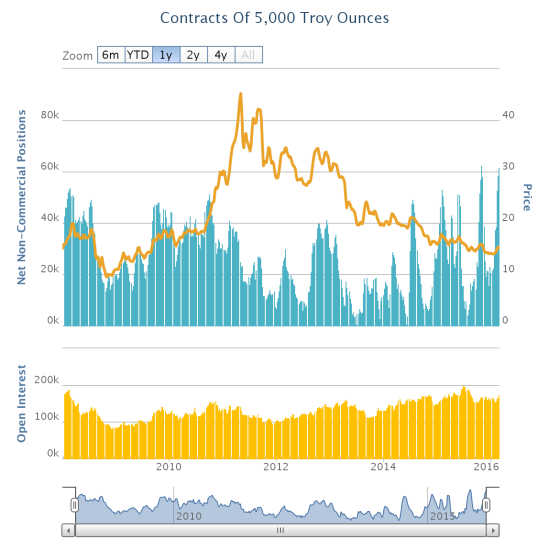
Near the end of the trading day (3:30pm Eastern) delivered the latest CFTC’s Commitments of Traders (COT) data on the positioning of speculators. Silver has net long positions that have almost matched the multi-year high from October, 2015. This means that bullishness is running exceptionally high. It is make or break time for silver. Gold has also experienced a surge in net long positioning by speculators, but current levels are still well below last October’s high and nowhere close to previous highs since 2008. There is still room to run for gold on this basis.
Speculators are riding really high on silver.
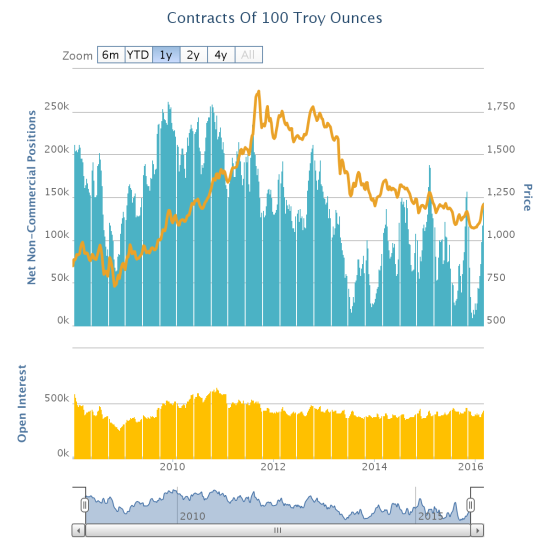
Speculators are bullish on gold, but they have been far more exuberant in previous years.
At the time of typing, China has just announced that it has yet again dropped its reserve requirement ratio. This follows another deep plunge in China’s stock markets with the Shanghai Composite falling 6.4% on Thursday ahead of a G20 meeting in Shanghai. In currency markets, the typical risk on trades received knee-jerk positive responses and thus stocks should be at support at least at the open of U.S. trading. We could once again get the seemingly odd move of the dollar index increasing along with gold (and silver) only because the euro (N:FXE) has taken on the mantle of funding currency for carry trades.
Be careful out there!
Full disclosure: net long the U.S. dollar, long GLD, long TLT call options, long SLV call options, long GLD, net short the euro

