
T2108 Status: 13.5% (2nd day of 3rd oversold period in last 8 trading days, a new 38-month closing low!)
T2107 Status: 31.7% (a fresh 34-month low!)
VIX Status: 21.2 (intraday high was a 22-month high)
General (Short-term) Trading Call: Here we go again! Continue reducing shorts, aggressive traders should have added to positions when VIX cracked the new high, conservative traders can continue to wait until T2108 exits oversold conditions. See below for more details and explanations.
Active T2108 periods: Day #2 under 20% (2nd day of oversold period), Day #14 under 30%, Day #20 under 40%, Day #22 under 50%, Day #24 under 60%, Day #66 under 70%
Commentary
“Here we go again. Except THIS oversold period looks ominously different” – this is what I said in the last T2108 Update, and it turned out to be even more appropriate than I was expecting. Sellers are firming their grip on the market and causing technical damage that may take a very long time to repair without fresh, positive catalysts. There are at least two very obvious and clear observations anyone active in the stock market can make. No complicated analysis is required to see a bearish chill developing as the major indices break down decisively and as fear accelerates.
The S&P 500 (SPDR S&P 500 (ARCA:SPY)) slammed right into its 200-day moving average (DMA). It probably avoided a breakdown just because sellers ran out of time before the close. The lower low is the first since February of this year, and it officially breaks the primary uptrend. The lower low in February was the first since the S&P 500 last broke down below its 200DMA in November, 2012. The uptrend defined by the 200DMA is in grave danger.
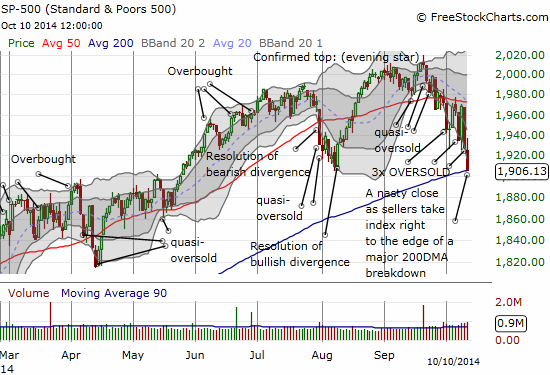
The S&P 500 slams into is most critical test since the 200DMA last cracked in Nov, 2012
The NASDAQ has already broken its primary uptrend as it suffered the hardest brunt of the selling on Friday (October 10th). While the S&P 500 lost 1.1% on the day, the NASDAQ did one better with a whopping 2.3% loss.
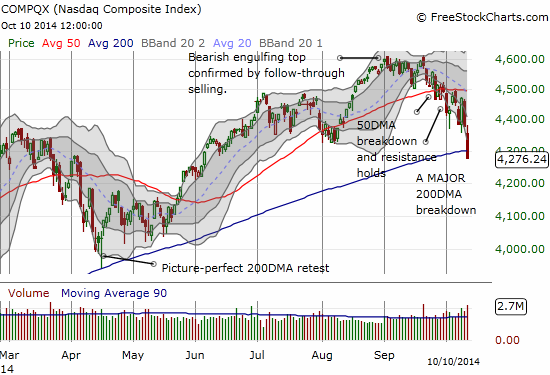
No picture-perfect retest of the 200DMA this time. Instead, a clean breakdown.
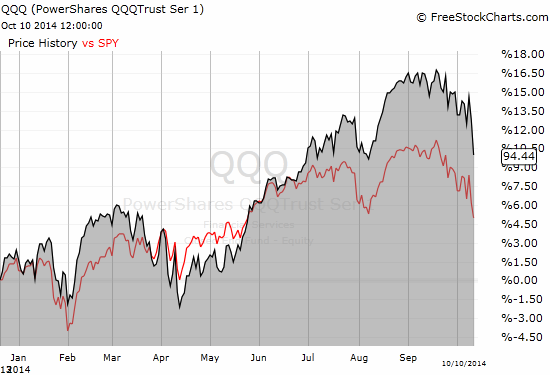
QQQ and SPY have moved together much of the year.
The VIX appropriately soared, increasing 13.2% to 21.2. Somehow, it managed to pull back below recent highs.
The VIX soars in what is now a very familiar pattern
This is all the obvious stuff. What is not nearly as obvious is what to do about it.
Some of your response will depend upon whether you are fundamentally bullish or bearish or agnostic. If you are bearish, I do not have much for you yet except a warning not to chase the market downward with fresh short positions unless you have a LOT of cash to buffer yourself through the inevitable snapbacks. Per the trading call above, you should be peeling off at least SOME positions to lock in profits and give yourself powder to short again at higher prices. If you are bullish, there is plenty of hope for bounces but a warning that the easy part of this bull market may have soundly ended. If you are agnostic, you should enjoy this increase in volatility. So now on to some details and revealing stock charts…
Sticking to my T2108 trading rules, I grabbed a second tranche of ProShares Ultra S&P500 (ARCA:SSO) call options even as I had to bid farewell to an earlier tranche that expired today worthless. This was the half I decided to try to ride after taking profits on the timely bounce on Wednesday, October 8th. For good measure, I added to my small gathering of put options on ProShares Ultra VIX Short-Term Futures (UVXY). I still did not get as aggressive as I am itching to do because of the critical technical breakdown in the NASDAQ and the S&P 500. The next, and likely the last, buy for this oversold period will happen if the VIX cracks the high from December 28, 2012 of 23.23.
Here are some reminders about the context of the T2108 trading environment.
First, the typical oversold period (below 20%) does not last long: a median of 2 to 3 days and an average of 5 to 6 days. We are on day number 2 now. Given this is the THIRD oversold period in 8 trading days, I think it makes to think of this period as a kind of continuation of the psychological angst characteristic of a deeply entrenched oversold period.
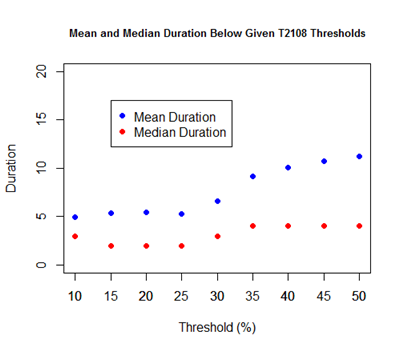
Mean and Median Duration Below Given T2108 Threshold
Second, the 30% underperiod is ticking away toward a danger zone. T2108 has traded under 30% for 14 days. Not only does the 30% underperiod RARELY last this long, but also in another 4 or 5 trading days, the projection for S&P 500 performance once T2108 trades above 30% again starts turning negative. The S&P 500 first dove under 30% on September 23rd with the S&P 500 closing at 1982.77. Even without this analysis, I find it difficult to imagine buyers can muster up the strength to take the S&P 500 up that high on the next bounce. Another test of 50DMA resistance would be doing well. The 50DMA is currently at 1972.27.
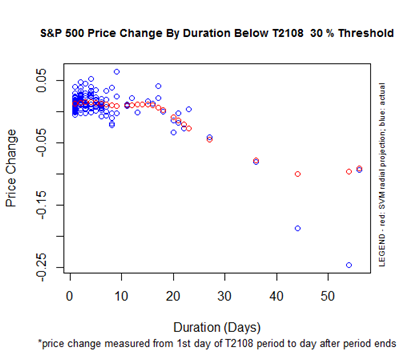
S&P 500 Price Change By Duration Below the T2108 30% Threshold
Third, T2108 is trading at an extremely low level. It has not closed at or below 13.5% in over three years. Last week, it traded as low as 13% before bouncing. A close below this level would suggest that the selling pressure is far from over.
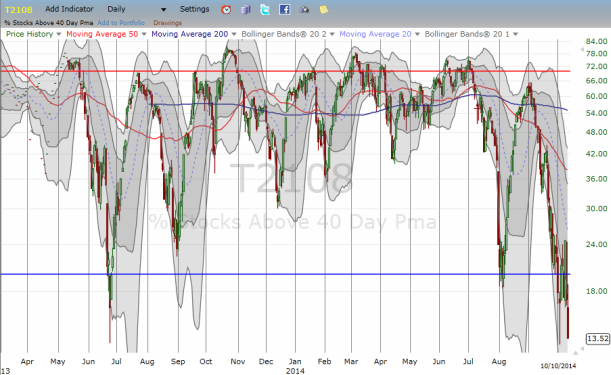
T2108 plunges again
Fourth, T2107, the percentage of stocks trading below their 200DMAs, is also now at 3+ year lows with a close at 31.7%. Anyone looking at charts of the stocks and ETFs in their portfolio is now looking at a LOT of broken uptrends…and getting really nervous as a result. Many of these stocks will take a long time to recover. Collectively, these breakdowns sow the technical and psychological seeds of a more significant sell-off.
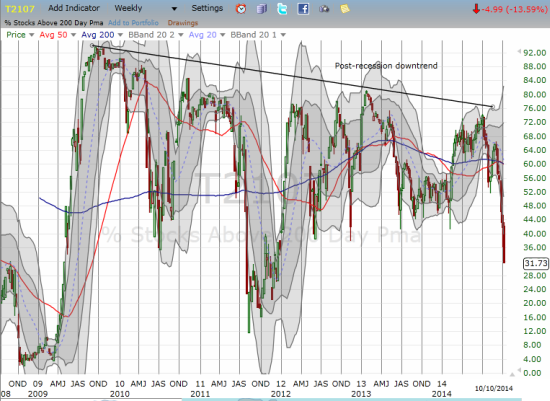
An alarming plunge in T2107
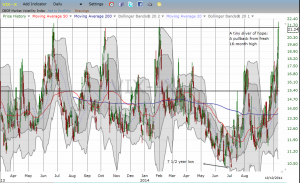
Fifth, the Australian dollar versus the Japanese yen (AUD/JPY) has finally broken down over the last two days and confirmed the sell-off in stocks. It is in bearish territory as long as it remains below 200DMA support turned into resistance.
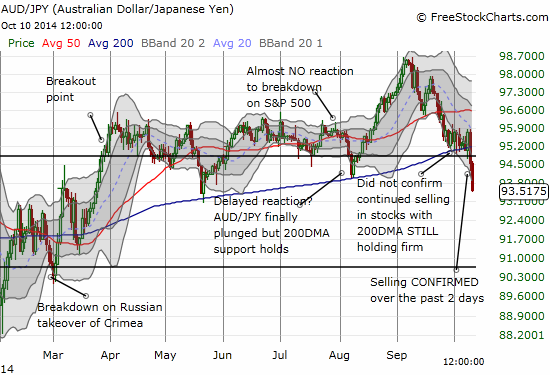
The Australian Dollar is at 5 month lows versus the yen and has flashed a bright red warning sign
Sixth, breaking the litany of bad news, Caterpillar (Caterpillar Inc (NYSE:CAT)) managed to hold steady despite the selling in the major indices. Could the persistent selling finally be over in CAT? Regular readers should recall that I like using CAT as a downside hedge and a confirmation (or early indicator if I am lucky) of trouble for the stock market. The daily chart shows a day of indecision where bulls and bears fought to a stalemate. The intraday chart may provide an even MORE telling story. CAT quickly sank after the open on a surge in volume and bounced sharply and quickly. Sellers hurriedly took control again but could not punch out a fresh low. Buyers were then able to take CAT into positive territory before the stock finally closed near flatline.
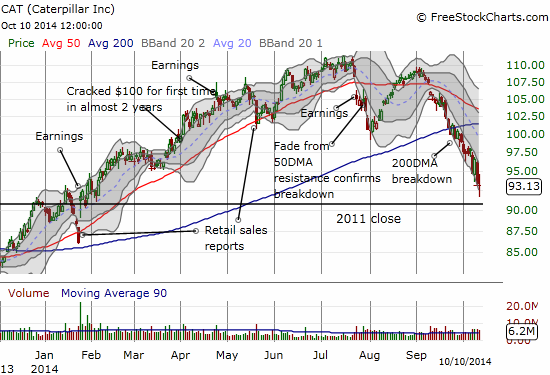
CAT reaches a stalemate in the middle of its sharp daily downtrend
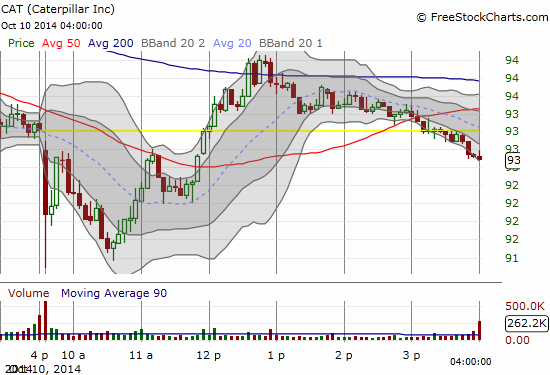
Did CAT finally shake its most determined sellers in a surge of volume right after the open?
From all this, I have concluded that the S&P 500 is due for a significant bounce in the coming week, but gains must be locked in quickly (no more patiently waiting for high risk trades to grow ever higher profits!). I am likely holding onto my few remaining short positions (all else being equal). The bulls and buyers now have the burden of proof. Resistance is presumed guilty until proven innocent.
The breakdown in the NASDAQ ahead of something similar for the S&P 500 puts tech stocks into (grim) focus.
Google (NASDAQ:GOOG) failed at 50DMA resistance on Monday and the very next day sold through its 200DMA support. Trading volume has surged as GOOG has expanded its 200DMA breakdown. If only I had been paying closer attention and buying PUTS this week! Note that GOOG is trading right back to where it closed four months ago when I claimed that a technician on CNBC was too early in declaring a breakdown in Google. That was a good 4-month run…
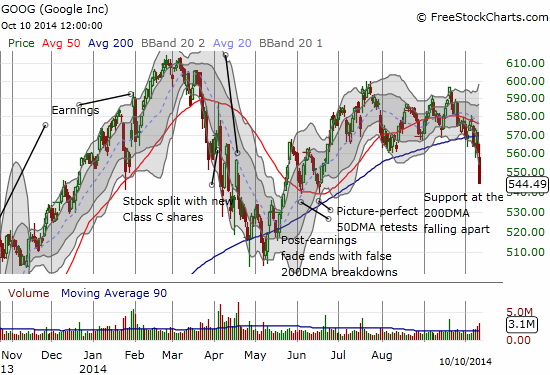
Google is breaking down
I am long overdue for writing an updated sentiment check on Twitter (NYSE:TWTR). Friday’s plunge straight to the important $50 pivot makes things very interesting now. To-date TWTR has been amazingly resilient and oblivious to the selling in the stock market. The stock even hit a 7-month HIGH this week! Needless to say this is NOT a stock to short until it shows some evidence of a breakdown.
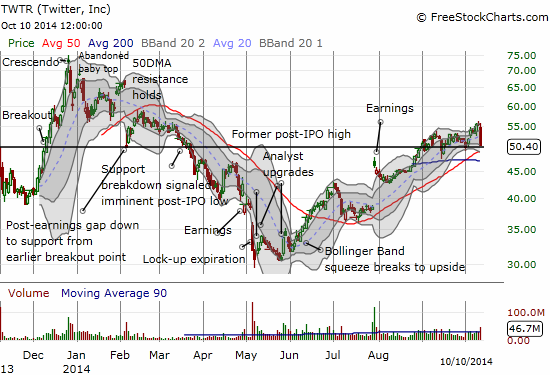
Amazingly, Twitter’s post-earnings (and post lock-up expiration) momentum has survived right through the stock market’s sell-off
Intel (NASDAQ:INTC) accompanied/led the semiconductor sector down in resounding fashion. In one fell swoop, INTC closed its post-earnings gap up. Sellers could not hold the lows as the stock was VERY extended below its lower-Bollinger Bands® (BB). I wish I had seen THAT when I was loading up on SSO calls. Needless to say, I am now watching INTC a lot more closely…especially given my budding strategy to buy INTC between earnings. The volume surge combined with the vicious breakdown from 50DMA resistance likely indicates that INTC has seen its highs for a good while now.
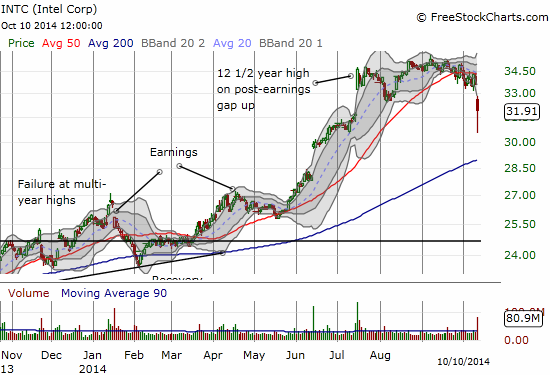
Intel may have finally met its match and carved out a top
Facebook (NASDAQ:FB) is trading somewhere between Twitter and Google in terms of technical behavior. Until Friday’s 4% plunge, the stock was churning in place directly above 50DMA support. That support has now decisively broken. I will not consider a top confirmed until FB wipes out the rest of its gains from its July earnings gap up. Even after that, a 200DMA test will still offer another chance for support for this expensive stock.
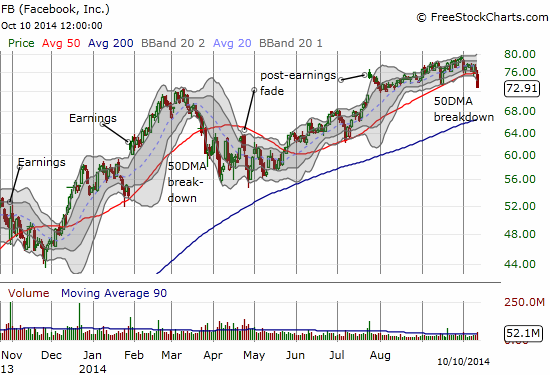
Facebook has fared a lot better than most tech stocks – it is only inches away from its all-time high and successfully kept sellers at bay until Friday
Finally, this quick review of tech stocks would be incomplete without Apple (NASDAQ:AAPL). Partially thanks to the latest Icahn drama, Apple has been completely oblivious to the market’s sell-off. The stock still comfortably sits within an extended trading range that has used $100 as a pivot that is frustrating bulls and bears alike still waiting for a decisive move.
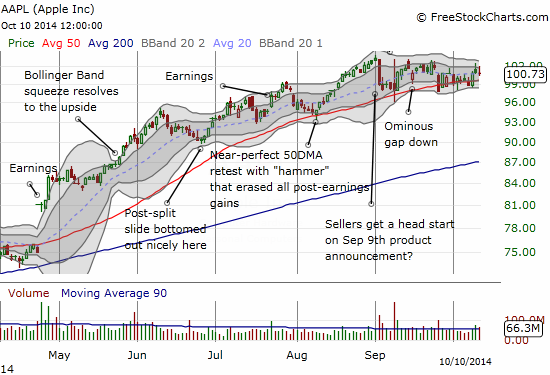
Apple’s chart shows absolutely no hints of the misery besetting the rest of the stock market!
Oh, and did I mention it is now earnings season? It looks like this time around, we are going to get some fairly significant and meaningful pre-warnings. Juniper (NYSE:JNPR) had the unfortunate timing to release its warning after hours on Thursday. The results on Friday were spectacular: a gap down, a 9.1% loss at the close, and an 11-month low for a year-to-date loss of 16%. I put some speculative call options as I expect Elliot Management to up the ante on getting JNPR management to “create value” for shareholders.
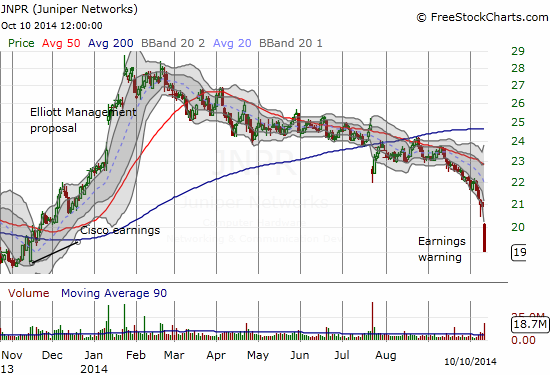
Juniper tumbles hard on a small adjustment downward in earnings and revenue expectations
This sample range of motion in stocks should serve as a good reminder that traders should still consider a stock’s individual merits and technical condition even when the general market is pointing decisively in a given direction.
Daily T2108 vs the S&P 500")
Black line: T2108 (measured on the right); Green line: S&P 500 (for comparative purposes)
Red line: T2108 Overbought (70%); Blue line: T2108 Oversold (20%)

Be careful out there!
Full disclosure: Long SSO call options and shares, long UVXY puts, net short the Australian dollar, short FB