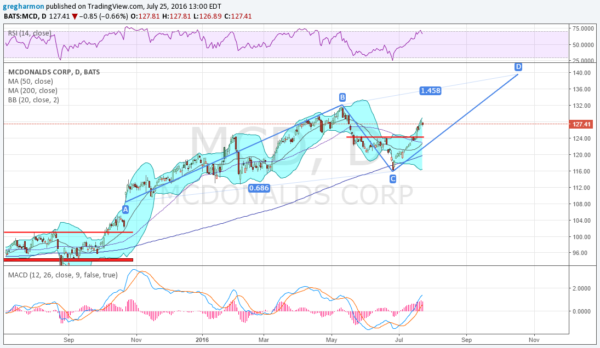
McDonald’s Corporation (NYSE:MCD) came out of a 7 month long channel in October last year when the company announced it would start serving breakfast all day long. It peaked 7 months later and 32% higher. Then it pulled back to the 200 day SMA in June, retracing half of the move higher. But it has been all uptrend since.
The price action since the gap higher in October has been building a possible AB=CD pattern, that wold target a move to about 140 if triggered. A price break over 132 would be the conservative trigger. In the meantime the break over the short term resistance at 124 was enough to get long the stock.
Into the earnings report the RSI is starting to turn back from a technically overbought level, but strongly in the bullish zone. The MACD is rising, and no where near the prior extremes. The Bollinger Bands® have opened to the upside to allow a continued move higher. Short interest is under 2%. The chart looks really good into the report.
Options expiring this week suggest traders see a $2.95 move in the stock price by the end of the week. That is about 2.3% and less than the 2.6% move the stock has made on average following the last 6 earnings reports.
Open interest shows the 126 Put Strike standing out, with 2,000 contracts, 4 times bigger than any other Put Strike. But it is dwarfed by the 13,000 contracts at the 128 Strike on the Call side.
Trade Idea 1: Buy the July 29 Expiry 127/128/129 Call Butterfly for 25 cents.
Trade Idea 2: Buy the July 29 Expiry 126/128/130 Call Butterfly for 50 cents.
Trade Idea 3: Buy the July 29 Expiry/August 128 Call Calendar for 77 cents.
Trade Idea 4: Buy the July 29 Expiry/August 128 Call Calendar and sell the August 12 Expiry 124 Put for free.
Trade Idea 5: Sell the July 29 Expiry/August 127 Put Calendar for a 70 cent credit.
Trade Idea 6: Sell the July 29 Expiry 125/130 Strangle for a $1.00 credit.
The first two trades look for the large open interest at 128 to draw and hold the price this week. Trades #3 and #4 also look for 128 to hold it this week and then continuation higher, with #4 adding leverage and a possible entry into the stock at 124 if it closes there or below on August 12th.
Trade #5 participates in any downside this week and then looks for a rebound above 127 by August Expiry. Trade #6 is profitable on a close between 124 and 131 Friday. I personally like the calendars the best. How about you?
DISCLAIMER: The information in this blog post represents my own opinions and does not contain a recommendation for any particular security or investment. I or my affiliates may hold positions or other interests in securities mentioned in the Blog, please see my Disclaimer page for my full disclaimer.

