We look again today at silver's 6-month cycle and how it helped form the PMs' historic turning point, along with the related backdrop in long rates and the 3 major currencies.
PRECIOUS METALS
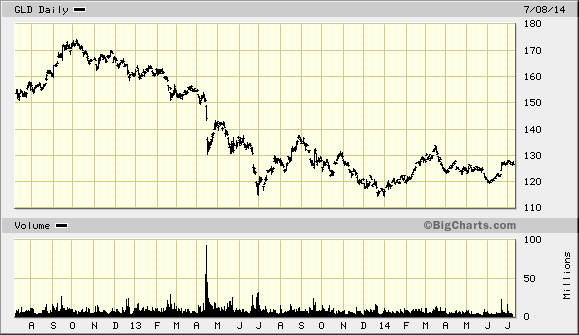
Both 2-year charts below, (SPDR Gold Trust (ARCA:GLD) and iShares Silver Trust (ARCA:SLV)), reflect reverse shoulder-head-shoulder bottoms, including what is most easily seen as a triple-bottom in the case of silver.
On June 1, 2014, I wrote:
"I have played my part in popularizing the 6-month cycle.
"Different internationally popular publications that follow my work have made similar forecasts and my conclusion therefore is that silver has bottomed and that the June 30 6-month cycle low will therefore suppress any advance, rather than actually depress it.
"In other words, sellers who became mindful of the increasingly popularized cycle have already sold, leaving the month ahead to play the role of suppressant,rather than depressant."
Regarding silver's 6-month cycle, not only did June NOT bring the new low that many had now come to expect due to the cycle's popularisation, but the past month gave the PMs their substantial initial lift-offs (percentage-wise).
Also from June 1, 2014:
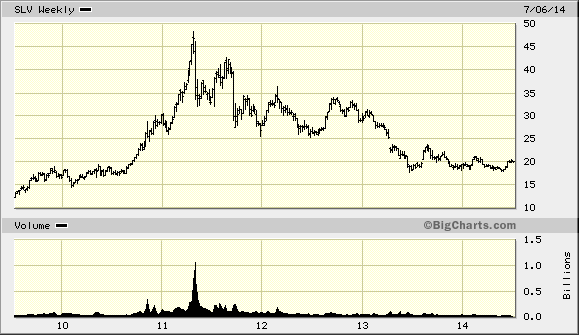
"The 5-year SLV charton the next page depicts a triple-bottom over the past year, which can easily blast off once it breaks over and past the downtrend channel.
"According to how one would connect the chart points from 2011 to the present, that break occurs anywhere between $20.00 - $21.50, believe it or not.
"It is a mere statement of technical fact that the downtrend channel is that near, and there are rules and an extensive multi-century history of what occurs with respect to such patterns."
When contemplating the excerpts from the June 1, 2014 report, within that context, to draw a downtrend channel, please connect the second lower high in 2011 to the high at the end of 2012.
Please note that little upward movement is required to cause a breakout. Regarding this fact, here is my related interpretation:
Ordinarily, there would be a slow ascent off of a base, as opposed to such a lengthy sideways move at the very bottom, which was caused by market manipulation to support faith in the fiat currency.
Therefore, whereas the algorithms would have been tripped by upside breaks of levels at 22 and 24, suppose, multiple wires could get tripped all at once by a break over 21, simply because the reposes at overhead resistance levels may be so unusually brief.
The 5-year and 2-year SLV charts follow, respectively:
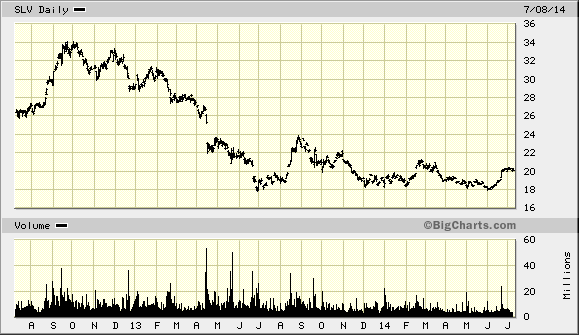
If we saw $32.50 on the SLV in the second half of the year, I would hardly be surprised.
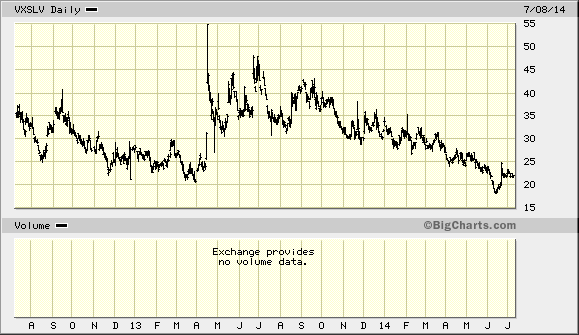
This section-concluding 2-year VXSLV chart (SLV option time premiums) offers a clue as to the next entry point, if one is not yet fully long, as per the recent reports.
Simply, as opposed to being over-interested in the SLV itself, one can judge whether or not a higher low has been seen in silver by noting how the VXSLV is behaving.
For instance, a test of the 20.5-level in that index—should it occur—may be the best indicator off of which to play.
The reasoning is simple: Option premiums gage psychology. If the latter is at a low, one need not consider the price action of the underlying security as much, since the sentiment level that discounts the price low would have already been achieved.
Again from the June report:
Recent reports and articles have plainly strategized the use of January 2016 SLV calls, new buyers' remaining 50% purchase of which should be completed by June 30.
Indeed.
We are likely watching a historical turning point in the early phases of acceleration.
LONG BONDS (iShares Barclays 20+ Year Treasury (ARCA:TLT))
February 1, 2014:
"Since identifying the precise peak just above 126, the TLT has plummeted to almost par. Now, it has rallied ~7 points and, in doing so, has broken the vicious downtrend.
"While I believe that a near term top is being made, no meaningful consolidation should take place before completing this march toward ~110, at which point the chart should finally reflect some bearish divergences.
"Until then, lower rates are to be expected....and then later in the year as well, as the 114 resistance level acts as a magnet(emphasis added).
"As we can see, the very lofty level of the TLT's slow stochastic suggests plainly that any pullback will indeed create a bearish divergence when the TLT subsequently rallies to ~110."
As the 2-year TLT chart below illustrates, the February 1, 2014 analyses proved to be correct across the board.
However, the April - June period did not provide the depth of short term correction that I had thought would be possible, because"later in the year" proved to be sooner in the year. In fact, the TLT advance passed 114, en route to 115.
Sure enough, from that key resistance zone we did in fact see the overdue correction get going this month, having already challenged neckline support.
The upshot is plain: Bonds are overpriced, while PMs are underpriced. Market action will have reflected that reality through the second half of 2014.
U.S. DOLLAR
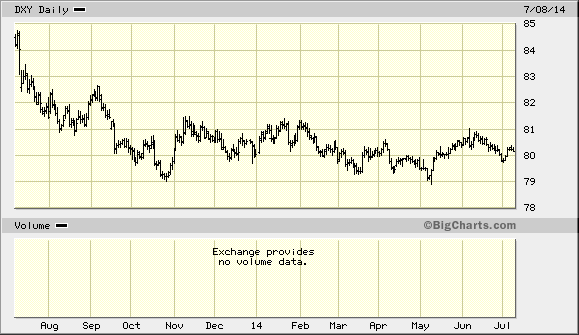
Please see the 1-year US Dollar Index chart below.
When viewed in conjunction with longer term analyses (not shown), we see that the long term expanding triangle indeed dragged out point-7 to have stopped at a higher level than what such a pattern would have ordinarily called for, since time replaced price, as per the previously contemplated alternate scenario.
Also, the inverse of the Shanghai chart's analysis, the multiple (greater than 3, if we see 81 again) challenges of the Dollar index's 81-level suggests that that area could indeed be breached to the upside.
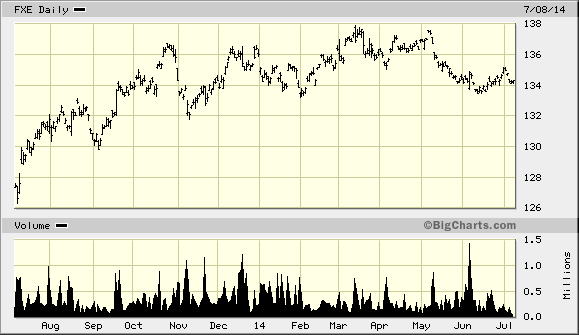
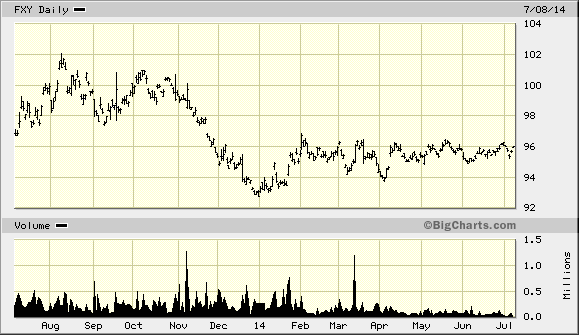
To understand how this could occur, we must consider the FXE (euro ETF) and FXY (yen ETF) charts since, as I have often reported, the dollar is given the appearance of stability, by manipulating a balanced inverse relationship between the euro and yen.
Viewing the second of the following three 1-year charts, the euro may be completing, or may have completed a right shoulder from which the currency could dive, while the yen could easily crack 96 to the upside, given its several assaults on that level.
The dollar does NOT need to head lower to support higher PM prices. That's yesterday's paradigm.
Europe's easily forecasted sprinting spree will get the job done, as I discussed and illustrated early in the year when Draghi's intentions for the latter half of 2014 were made painfully obvious.
