Wednesday, May 18
![]()
Thursday, May 19

Friday, May 20
![]()
Salesforce.com Inc (NYSE:CRM)
Information Technology - Software | Reports May 18, after the close.
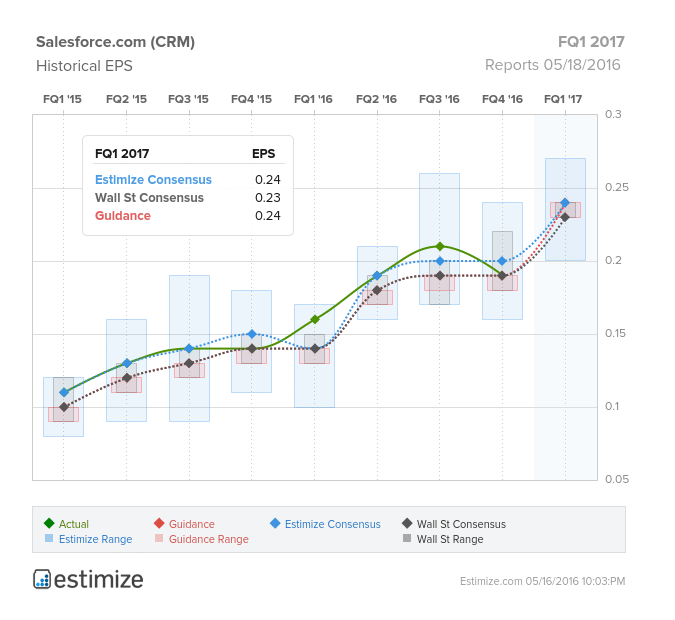
The Estimize consensus is calling for a profit of 24 cents per share on $1.9 billion in revenue, 1 cent higher than Wall Street on the bottom line and $4 million on the top. Compared to a year earlier this reflects 49% growth in profits and 25% in sales. This is a name that is seeing upward revisions into its report, with EPS expectations increasing 9% since the Q4 report.
In this rapidly changing tech environment, strong earnings are simply not enough to push share prices. Despite a 22% gain in the past 3 months, the stock is still slightly down year to date.

What to watch: By any measure, Salesforce (CRM) is firing on all cylinders heading into its first quarter report. The leader in CRM software has continually reported double digit gains in both revenue and profit.
Strong growth has been fueled by key partnerships with big tech names such as Microsoft (NASDAQ:MSFT), organic sales growth in its cloud based services, and the acquisition of smaller competitors which have been successfully integrated into their own suite. Higher demand for marketing and analytics tools, part of its new lightning platform, presents a new opportunity to sustain rapidly expanding growth rates.
Salesforce is one of the leaders in cloud computing and SaaS services. The company’s pipeline of new initiatives continues to grow as they diversify their portfolio of services. In particular, Salesforce is seeing increasing traction from its new pricing strategy surrounding its Lightening UI platform launched late last year. Moreover, adding a layer of analytics to its suite of services will be an important long term driver. International growth also presents a major opportunity for Salesforce.
Nearly 75% of revenue currently come from North America, which is okay for now given the strength of the U.S. dollar but diversifying to other regions should not go unexplored. The biggest news coming out of Salesforce recently is its intent to launch an Internet of Things cloud on Amazon Web Services.
Wal-Mart (NYSE:WMT)
Consumer Discretionary - Food & Staples Retailing | Reports May 19, before the open.
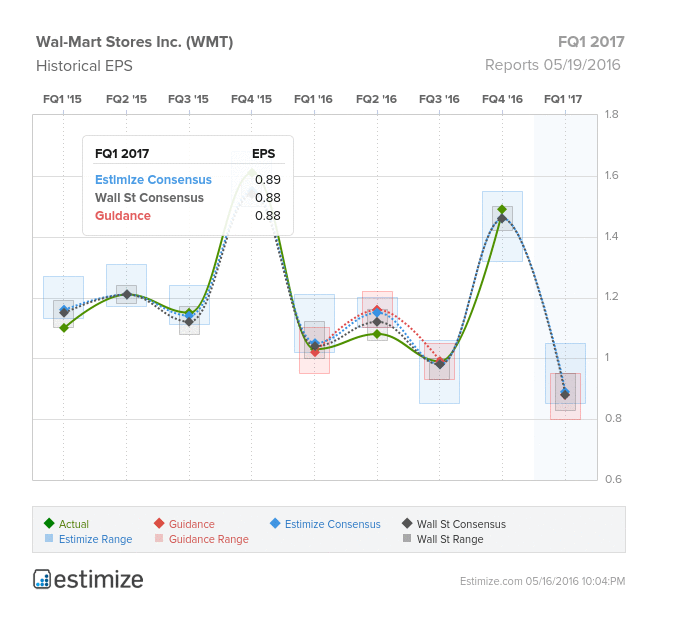
The Estimize community calls for EPS of $0.89, 1 cent above Wall Street. Revenue expectations from Estimize are also higher at $112.78 billion as compared to the Street’s $112.68 billion. Estimates have remained relatively flat over the last 3 months, with EPS expected to decline 13%, and sales anticipated to remain in-line with year-ago results. The retailer doesn’t have a great history of beating, only surpassing the Estimize EPS consensus in 44% of reported quarters, and revenues 13% of the time.

What to Watch: First quarter reports out from retailers thus far have been largely disappointing, with Macy’s Inc (NYSE:M), Nordstrom (NYSE:JWN) and Kohl’s Corporation (NYSE:KSS) all missing revenue expectations last week. As the consumer becomes more value-driven, it’s possible the discounters, such as Wal-Mart (WMT), Target Corporation (NYSE:TGT) and TJX Companies Inc (NYSE:TJX) which all report this week, will be the big winners.
However, it seems the negatives are stacking up against Wal-Mart. At the end of last year the retailer warned that the outlook for fiscal 2017 would be even worse than initially expected, with YoY profits anticipated to decline 6 - 12% due to wage hikes and FX headwinds. As a result, the retailer will be closing 270 stores in the U.S. and overseas. Many locations affected are smaller Wal-Mart Express stores, and announced closings represent less than 1% of Walmart’s worldwide sales. Despite store closures, Walmart plans to open over 300 new stores in fiscal 2017, including 50 to 60 super-centers in more profitable locations.
The world’s largest retailer has also announced several new initiatives for the year. It is no secret that Wal-Mart has feverishly worked to improve their e-commerce experience as they try to compete with internet retailers such as Amazon (NASDAQ:AMZN). They are also looking to develop a digital relationship with customers through the launch of Wal-Mart Pay, the first step in their e-payment strategy.
Up until this point, no mobile payment methods such as Apple (NASDAQ:AAPL) Pay or Google (NASDAQ:GOOGL) Wallet were accepted at the retailer’s locations. The e-payment option will be accessible through the Wal-Mart app which is already being utilized by 22M customers each month. The grocery segment also has become a large focus, although that area is beginning to get more and more crowded with competition from the likes of Kroger (NYSE:KR), Trader Joe’s and others.
Gap Inc (NYSE:GPS)
Consumer Discretionary - Specialty Retail | Reports May 19, after the close.
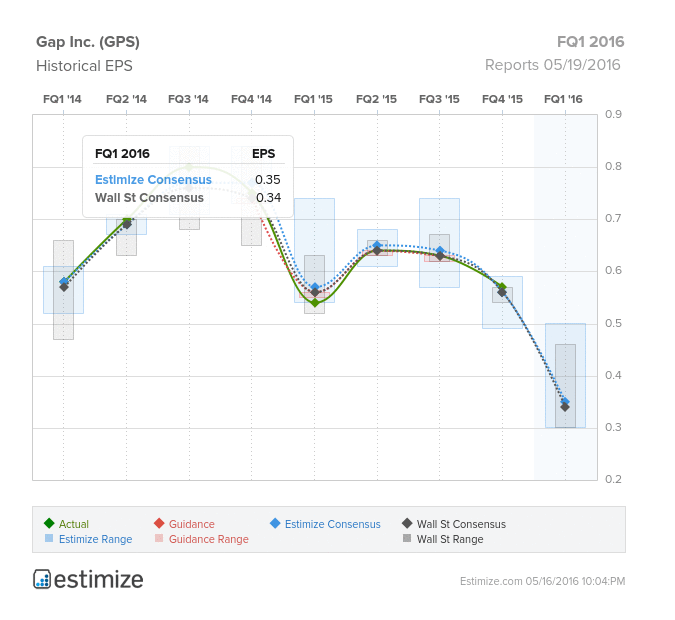
The Estimize consensus calls for EPS of $0.35, one penny above Wall Street. Revenue expectations are also slightly more bullish at $3.46 billion vs the sell-side’s $3.44 billion. However, these numbers have been trending downward since the last quarterly report, with EPS estimates falling 26% and revenues down 3%. This puts growth expectations at -30% for EPS and -5% for sales. This is a company that has historically beaten on the bottom-line in 63% of reported quarters, and on sales in 50% of reported quarters.

What to Watch: Last Monday, Gap (GPS) gave a Q1 warning that sent estimates into a downward spiral. They reported that EPS would be in the range of $0.31 - 0.32 and revenues of $3.44B. Since then, EPS estimates have tanked to their current level of $0.35 from $0.46, and revenue expectations are down to $3.46 from the prior level of $3.53B. Weaker than expected traffic for the quarter resulted in higher levels of inventory and pressured gross margins.
This would mark fifth consecutive quarter for declining earnings and revenues. Weak fundamentals have weighed heavily on the company, with the stock down 55% in the last 12 months. This comes as a result of persisting currency headwinds and disappointing performance of its core brands. Consistent with this trend, Gap recently reported a 5% decline in comparable store sales for Q1 2016, compared to -4% in Q1 2015.
Old Navy, once the savior for this retailer, also posted -6% comp store sales as the brand continues to struggle, with Banana Republic even worse off at -11% for the quarter. Competitive pressure has played a major role in Gap’s soft sales outlook, as fast fashion companies including H&M, Forever21 and Zara have effectively cut into Gap’s already dwindling market share.
The retailer operates in a highly fragmented market where it has failed to offer high quality, distinguished products at a competitive price. Moreover, the company is committed to a store growth strategy with a focus on Asia, its Athleta brand and global outlet stores. Unfortunately, these efforts are not expected to mask Gap’s glaring weaknesses when it reports first quarter earnings.
Foot Locker (NYSE:FL)
Consumer Discretionary - Specialty Retail | Reports May 20, before the open.
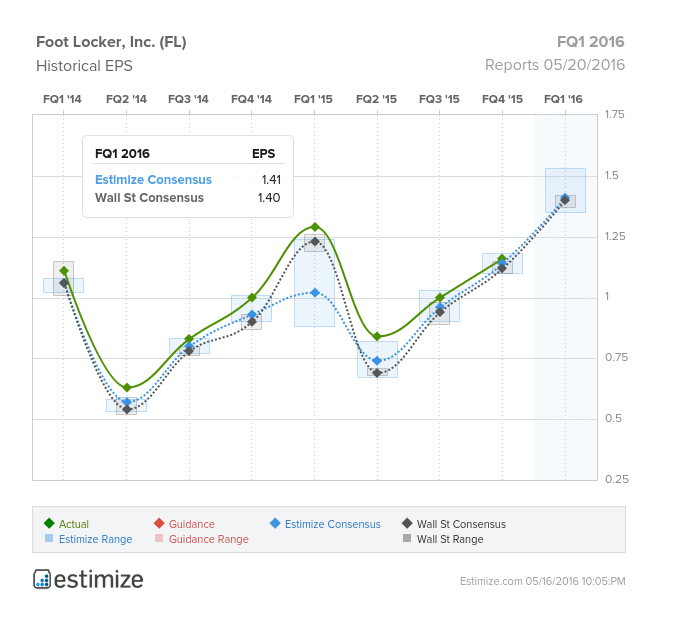
The Estimize consensus calls for EPS of $1.41, one penny above Wall Street. Revenue expectations of $2.0 billion are right in-line with the sell-side. Estimates on both the top and bottom-line have seen a slight downtick since the Q4 2015, with YoY EPS growth expected to come in at 9% and revenue growth of 5%. FL historically has beaten both EPS and revenue estimates more than 80% of the time.

What to Watch: In the last 9 quarters, the New York City based chain has beaten analyst expectations with impressive earnings surprise numbers. Driving this success has been the popularity of basketball shoes, a niche that Foot Locker (FL) has clearly carved out.
Basketball shoes account for a large portion of Foot Locker sales, as the company holds most of the major brand names. Yearly special releases of “Jordan’s,” “LeBron’s” and even one of Adidas’s most highly touted releases of all-time, the new Derek Rose sneaker, bolstered same store sales over the holiday quarter, rising 7.9% in Q4. Foot Locker is more than proficient in several of the other lines it carries as well, mainly running and casual.
Foot Locker does a great deal of business outside of the United States. They have high exposure to some of the largest international markets as roughly 30% of 2015 total sales came from abroad. The strength of the US dollar throughout 2015 was responsible for a $0.23 impact on EPS vs. 2014 for the athletic retailer, who then had to increase prices to help offset. The FX impact may amount to a few cents in 2016, but the company believes we have “cycled through a bulk of the FX impact” as the dollar begins to stabilize.
How do you think these companies will perform this week?
