Get 40% Off
👀 👁 🧿 All eyes on Biogen, up +4,56% after posting earnings. Our AI picked it in March 2024. Which stocks will surge next?Unlock AI-picked Stocks

5 Signals Indicating A Market Top (All Happening Now)

Published 10/26/2014, 01:02 AM
Updated 07/09/2023, 06:31 AM

Here are the 5 things that you might see near a market top:

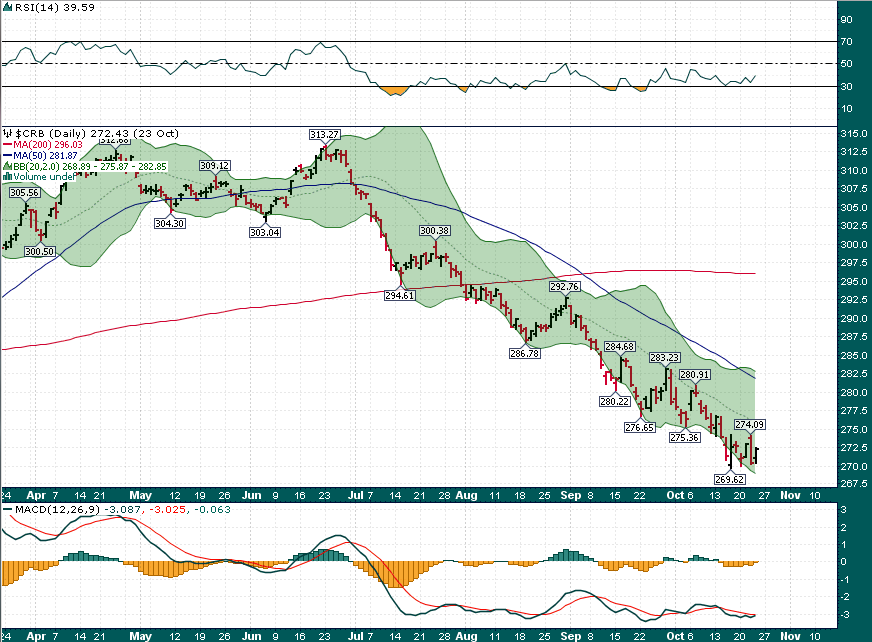
1. Commodities rolling over

CRB Index

CRB Daily

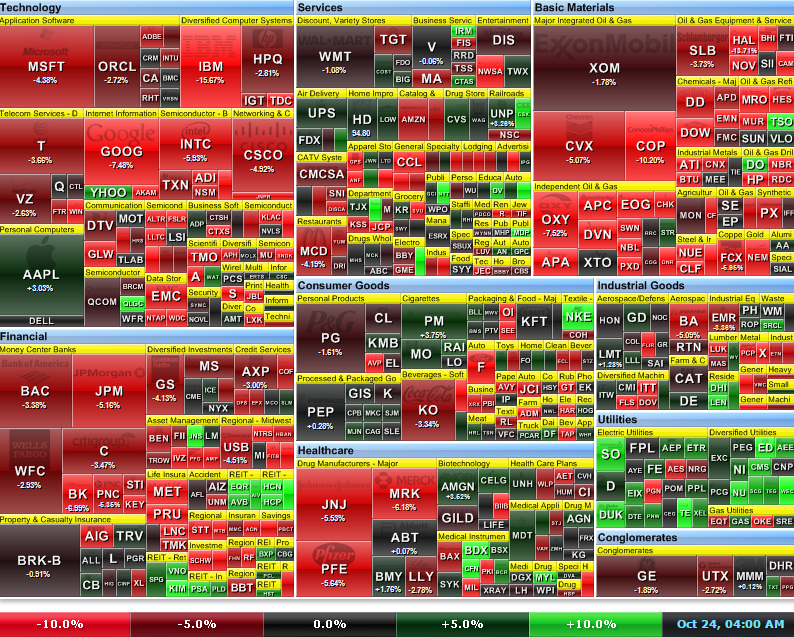
2. Deteriorating market breadth...

...with leadership sectors (energy, financials, and technology) getting hit especially hard.

S&P 500 1-month heat map

SPX 1-Month Heat Map

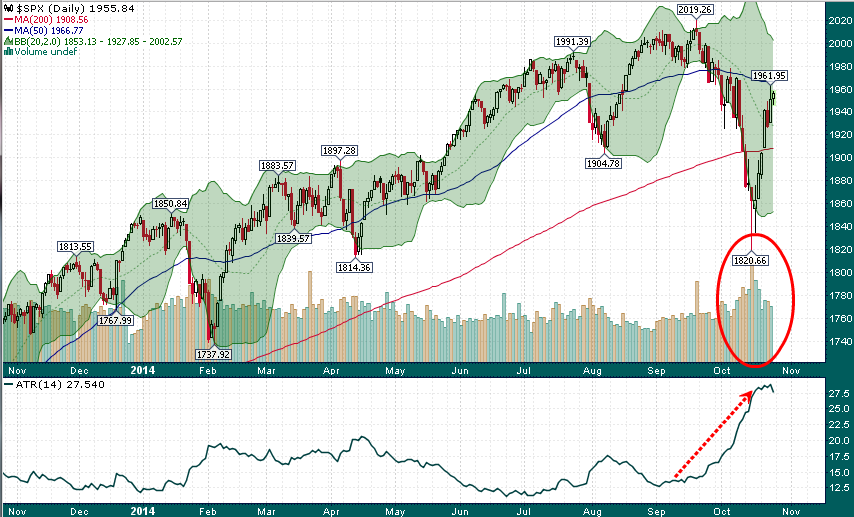
3. Volatility and volume expansion

S&P 500 daily with average true range below:

SPX Daily With ATR

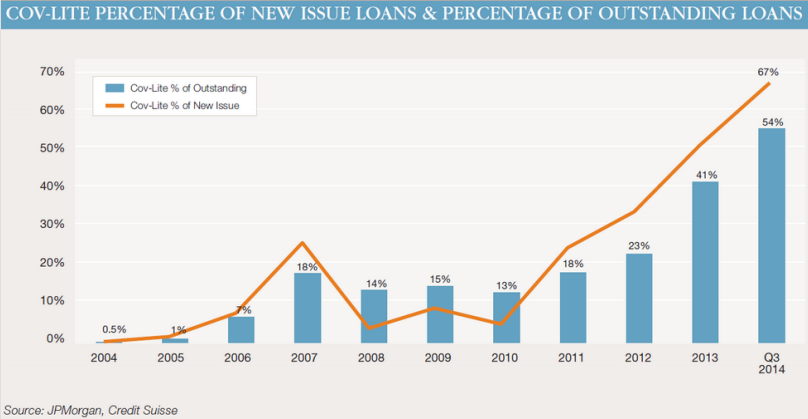
4. Sharp increase in high risk lending

Cov-lite loans percentage of new issues and percentage of outstanding loans

Cove Lite New Issuence

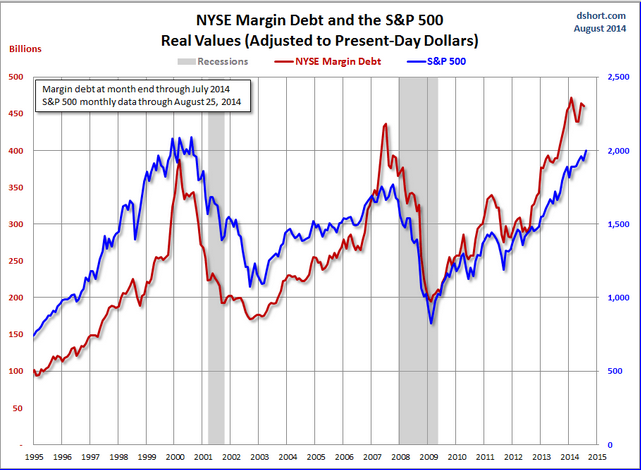
5. Record levels of equity investor margin debt

Marging Debt vs SPX

And the best part is that they are all happening right now…..

Original post

Latest comments

Crude will test again 80.4
Humphreys is awful
He sure is,,,,do the opposite of whatever he says!!
Watch closing month of future for S&P and DOW candle chart (monthly), The five waves has been accomplished, it has been broken during this month trading, but last week was recovered, and start to form " HAMMER CANDEL ", closing the end of the month will decide in which direction the fifth wave should be broken!!! beginning of Oct. trading will be dramatic full with action and drama !!!
so i suppose you are ... short ! to make money
i really think s&p going back to level 1944.65 on monday...
How are "they all happening right now..." when the Debt chart is only updated to July/August? - Also $CRB is at lows similar to those of the end of 2013/early 2014 where the Stock market then kept charging higher (with $CRB rising even faster).. Then The Heat map is not current and does not reflect the (unusually) strong rebound in Tech, Financials, and Energy/Utilities.. We may very well be merely in a strong counter-trend to the recent nearly 10% drop, but how do you plan your own trades based on the provided charts?
S H O R T E D !?!?!?!?!?
Risk Disclosure: Trading in financial instruments and/or cryptocurrencies involves high risks including the risk of losing some, or all, of your investment amount, and may not be suitable for all investors. Prices of cryptocurrencies are extremely volatile and may be affected by external factors such as financial, regulatory or political events. Trading on margin increases the financial risks.
Before deciding to trade in financial instrument or cryptocurrencies you should be fully informed of the risks and costs associated with trading the financial markets, carefully consider your investment objectives, level of experience, and risk appetite, and seek professional advice where needed.
Fusion Media would like to remind you that the data contained in this website is not necessarily real-time nor accurate. The data and prices on the website are not necessarily provided by any market or exchange, but may be provided by market makers, and so prices may not be accurate and may differ from the actual price at any given market, meaning prices are indicative and not appropriate for trading purposes. Fusion Media and any provider of the data contained in this website will not accept liability for any loss or damage as a result of your trading, or your reliance on the information contained within this website.
It is prohibited to use, store, reproduce, display, modify, transmit or distribute the data contained in this website without the explicit prior written permission of Fusion Media and/or the data provider. All intellectual property rights are reserved by the providers and/or the exchange providing the data contained in this website.
Fusion Media may be compensated by the advertisers that appear on the website, based on your interaction with the advertisements or advertisers.
© 2007-2024 - Fusion Media Limited. All Rights Reserved.