Charts Can Assist With Bullish And Bearish Probabilities
A reader of this post may come away with the impression the author has a bullish bias. However, the charts below, in the end, could also be helpful in identifying increasing bearish probabilities. We will look at hard evidence using price, retracements, trendlines, consolidation boxes, and moving averages.
Keep in mind, price, retracements, trendlines, consolidation boxes, and moving averages help us track the market’s current interpretation of all the fundamentals (earnings, valuations, Fed policy, the election, etc). Therefore, the facts and charts help us monitor all the inputs that impact the value of our investments.
The Charts Say What They Say
The charts say what they say and show what they show regardless of our personal views or biases. The only question is are we open-minded enough to see the charts as they are, rather than how our personal bias might want them to be?
What are the observable facts telling us right now?
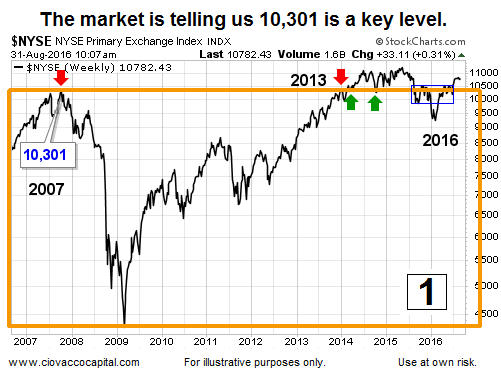
The weekly chart of the NYSE Composite Index shows that 10,301 acted as resistance in October 2007. Since revisiting that level back in 2013, the market has made it clear, via price action, 10,301 remains important.
The facts we have in hand lean bullish as long as price remains above 10,301. Conversely, bearish odds will pick up if the market fails to hold the key level. We learn something either way. The NYSE Composite Index was trading at 10,782 on August 31, 2016.
Fibonacci Inflection Points
When markets drop, we can pick up information about probabilities based on how price reacts at key Fibonacci retracement levels. Compare and contrast price action near the retracement levels in 2007-2008 and 2011-2012 (see red and green arrows below).
Now, compare 2016 to the long-term outcomes following the red and green arrows. Right now, price relative to the retracements looks more like bullish 2011-12 than bearish 2007-08.
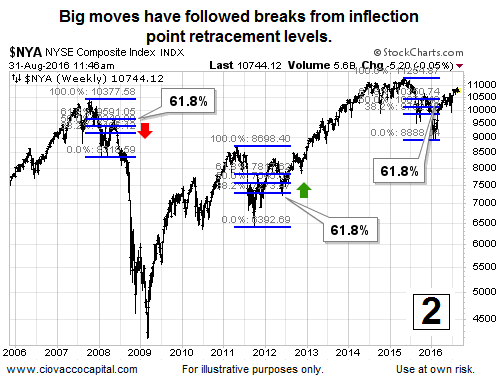
If the chart above deteriorates, we will learn something as well, but that falls into the “what may be” category. The chart above falls into the “what is” category.
Trendlines Dating Back To 2007
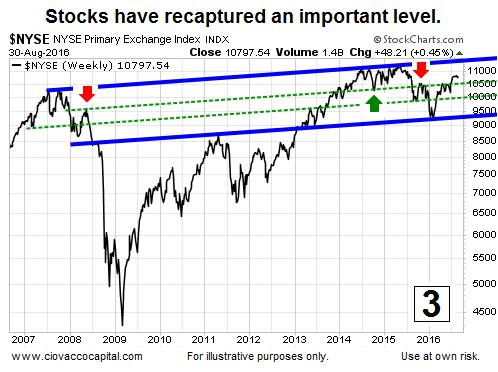
Markets tend to respect angles and parallel trendlines. The upper green trendline acted as resistance in 2008 (red arrow left), support in 2014 (green arrow), and resistance again in 2015 (red arrow right).
Price has broken back above the same green trendline during the current post-Brexit rally. As long as price holds above the green trendline, it improves the probability of a push back toward the upper blue trendline.
Long-Term Consolidation Boxes
The charts below are monthly charts. All three charts closed above their respective orange box on July 31, 2016. All three markets are on pace to print a second consecutive monthly close above the multiple-year consolidation boxes.
Larry Hite does an excellent job summing up the three charts that follow, via this excerpt from Market Wizards:
“The second item is something that Ed Seykota taught me. When a market makes a historic high, it is telling you something. No matter how many people tell you why the market shouldn’t be that high, or why nothing has changed, the mere fact that the price is at a new high tells you something has changed.”
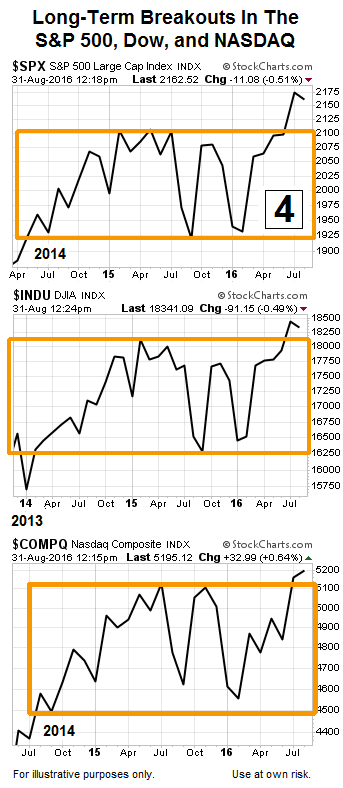
Look at the charts above and consider the Dow first entered the sideways/indecisive/consolidation box back in calendar year 2013. Now, reread the quote above.
The quote obviously remains more relevant if the breakouts hold; it they fail, it becomes much less relevant. We learn something either way (bullish or bearish).
Long-Term Moving Averages
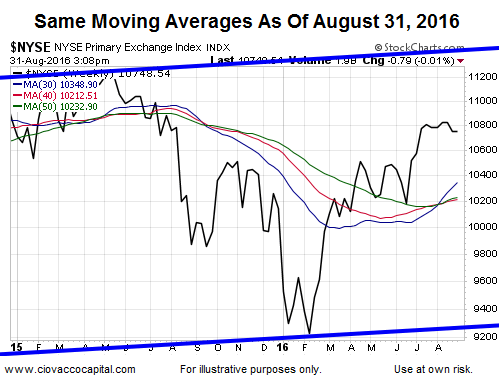
An August 20 analysis covered a bullish signal that has only occurred ten other times in the last 35 years. The chart below is as of August 31, 2016; the improved look described on August 20 remains in place.
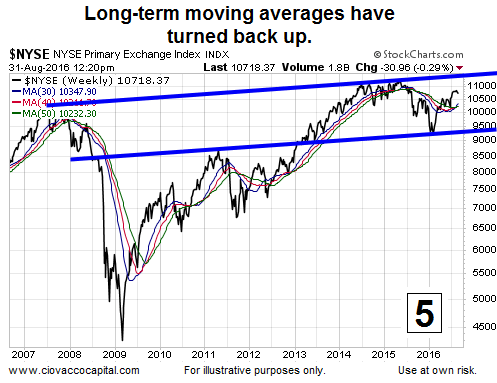
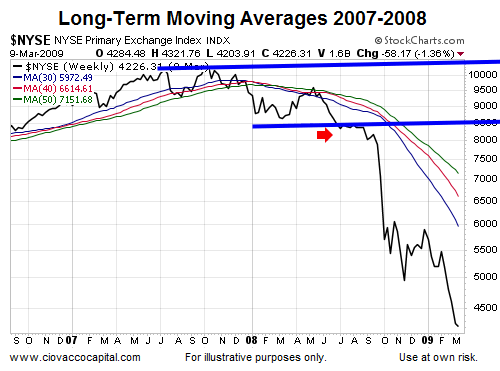
This is how the same moving averages looked as the stock market peaked in 2007 and rolled over in 2008. Compare and contrast 2016 above to 2008 below.
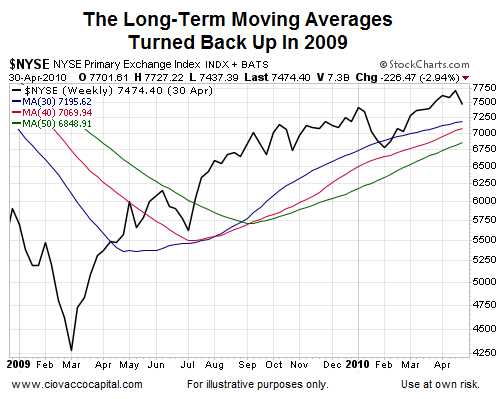
Long-term trend signals were helpful as the market regained its footing in 2009 in the wake of the financial crisis. Central banks played a large role in the turnaround.
Concerns about the Fed and economy left the market on shaky ground early in 2016. The chart below is as of February 12, 2016; notice how the market found support near the trendlines shown in chart 3 above.
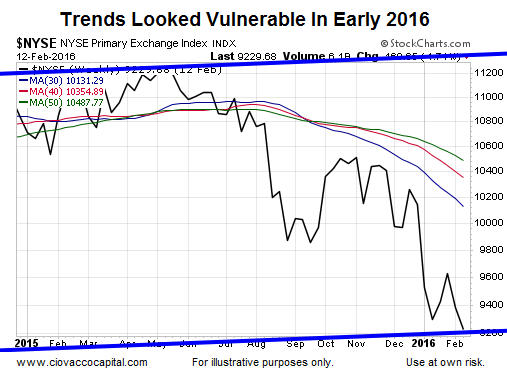
After the Fed backed off the “four rate hikes in 2016” stance and other central banks around the globe announced even more aggressive stimulus campaigns, the long-term trends started to improve.
The chart below is as of August 31, 2016. Compare and contrast the look of the present day chart below to the other turning points above (2007 and 2009).
What Is vs. What May Be
What is and what may be are radically different concepts. What is has a high degree of certainty; what may be has a high degree of uncertainty. Therefore, we prefer to make decisions based on what is rather than the nebulous what may be.
Predictions vs. Facts
Humans cannot predict the future. Markets cannot predict the future. Charts cannot predict the future. All three make probabilistic assessments of future outcomes based on the “knowns” of the day.
When new information comes to light, the markets reassess; any reassessment will be reflected in the charts. Therefore, if the charts change, the probabilities will change.
Thus far, both the charts and probabilities continue to favor good things happening relative to bad things happening.
