Often conversations about home buying end up in discussions on the high cost of homes today and their affordability – or lack thereof.
We decided to take a look at the long-term trends in home prices in comparison to income and found that incomes have been stagnant since the early 1970s, while home prices have risen dramatically in comparison.
In order to analyze income, we have used the Middle Quintile for households, which is the middle 20% of all households adjusted for inflation, with 2014 as our base year. The Census Bureau, our source for income data, began publishing annual reports for gross household incomes in 1967. For median home prices, our source is the American Household Survey, which published annual surveys from 1973 to1981 and bi-annually starting in 1983. For new home prices, we’ve used new residential sales data from the Census Bureau.
Let’s look at middle quintile income since 1967. Many economists and mainstream media correspondents often cite stunted income growth as a fundamental reason for economic sluggishness. Real (inflation adjusted) middle quintile income peaked in 2000 at $58,000. The real low for this data series was at the start of the series in 1967 at $44,000. The second lowest real income was in 1971 at $47,000. Remember – we're focusing on gross income before taxes.
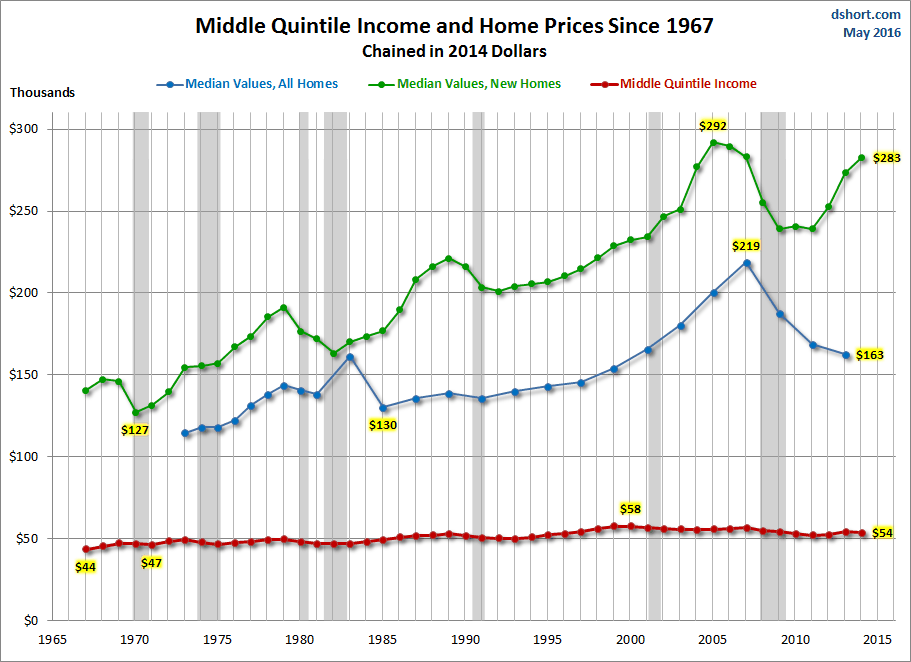
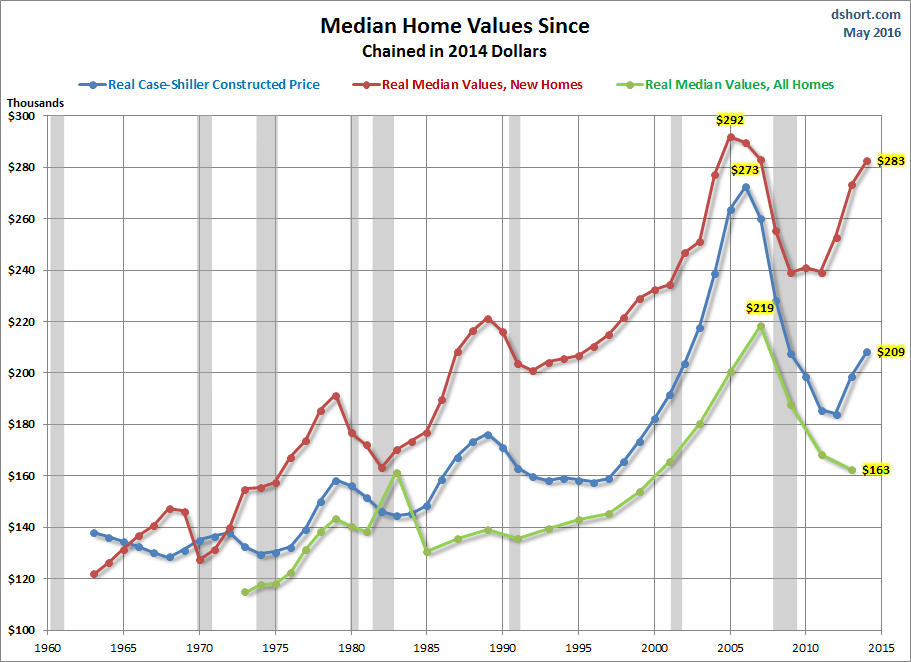
Notice in the chart above that after accounting for inflation, income has stayed flat while home prices have increased significantly over the last 47 years. The drastic increase in new and total home values are still not at pre-recession levels. Interestingly, new home prices have jumped back up and are nearing the peak of the housing bubble.
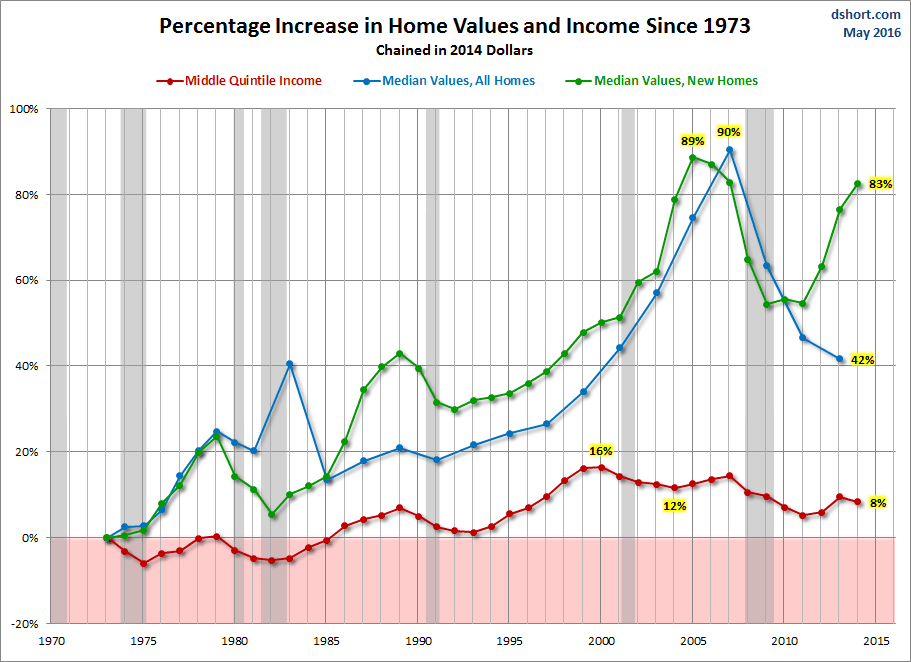
The next chart shows changes in income and home values since 1973. We can see the tremendous change in new home prices and its continuing rise since the end of the recession. Currently, incomes are about 8% higher than they were in 1973 while new home prices are a staggering 83% higher than in 1973.
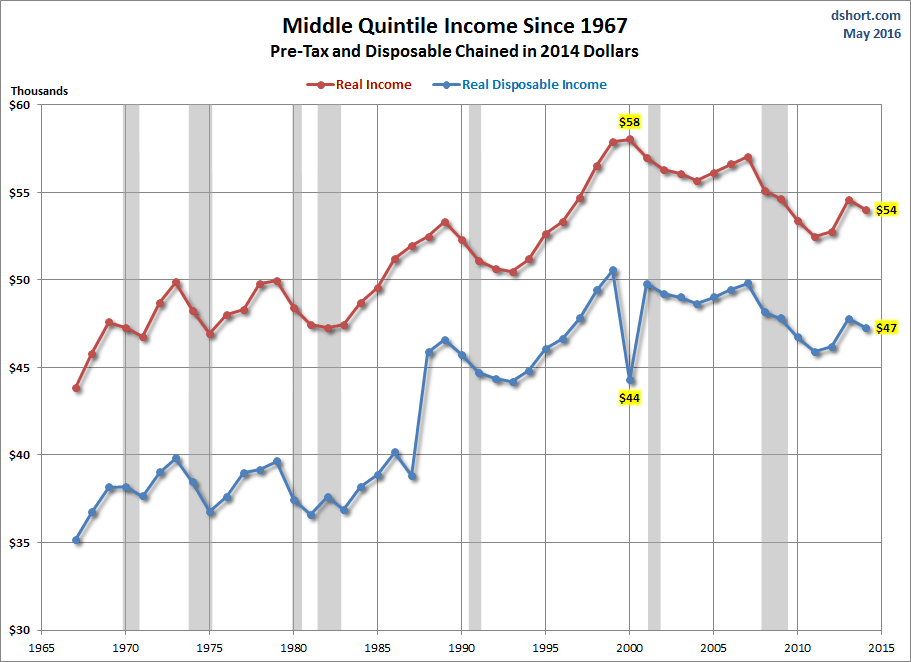
Here’s a quick comparison of pre-tax and post-tax middle quintile household income. Over the last quarter century, tax rates for this group have remained steady at 15%, with the exception of the year 2000 in which it was 28%, hence the dip in disposable income in the chart below. In order to find the post-tax real middle quintile income, we took out the respective standard deductions for each year, subtracted it from the original annual income, and then removed the respective taxes owed. The historical Standard Deductions used are from the Tax Policy Institute, a joint venture of the Urban Institute and Brookings Institution. Tax brackets for head-of-household are from the Tax Foundation.
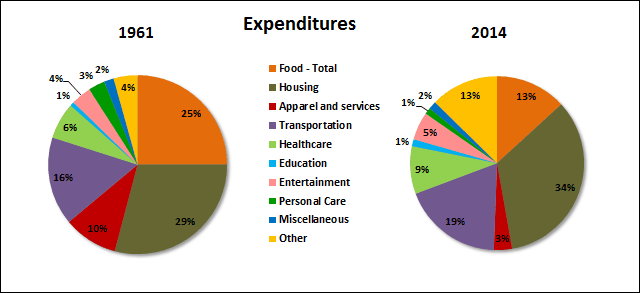
We’ve also taken a look at expenditures in comparison to income over the same time span. The Bureau of Labor Statistics began publishing the Consumer Expenditure Survey in 1960, followed by surveys in 1972 and then annually starting in 1984. We’ve looked at expenditures broken down by quintile. Here’s a snapshot of the makeup of expenses in 1961 and in 2014. Note the substantial reduction in expenditures on food, most likely due to the mass commercialization and improvements in shipping of food. Also of note is the increase in spending on transportation and the increase in expenditures on housing, while spending on apparel has decreased since 1973.The category denoted “other” includes reading, smoking, cash contributions (i.e. alimony, religious, charitable donations, etc.), retirement, pensions, and social security.
Lastly, we have constructed a home price series back to 1967 based on the Case-Shiller annualized index for comparison, which offers a useful perspective on historical home prices. We've chained the Shiller-Constructed series to the 2014 Existing Home Sales value from the National Association of Realtors and used the Case-Shiller index as our deflator. The Case-Shiller index is based on repeat sales and specifically excludes changes in the types and sizes of houses or changes in the physical characteristics in the calculations to avoid incorrectly affecting the index value.
In a future commentary we’ll be continuing our research on home prices – specifically the prices in metropolitan areas, which have seen even larger increases than the median US prices. We’ll also be digging deeper into expenditures and income within the quintiles. Be on the lookout for more in the coming months.
