
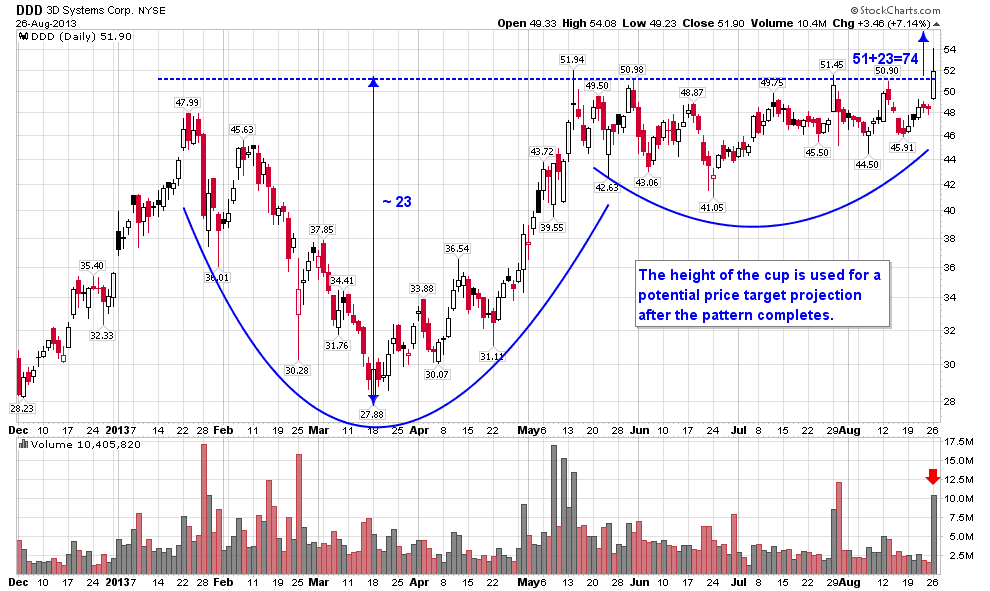
Over the last 3 month 3D Systems (DDD) has traded sideways and made several attempts to break out of a trading range. Today DDD has broken out of a 3-month consolidation base on high volume and closed above $51. It remains to be seen if it is a real breakout this time; at least I hope to think so. The 3-month consolidation pattern appears to be the Handle part of a bigger 7-month Cup-And-Handle pattern. The height of the cup is usually used for a potential price target calculation after the pattern completes. In case of DDD, the stock has a potential to go up to $74, based on this kind of projection.
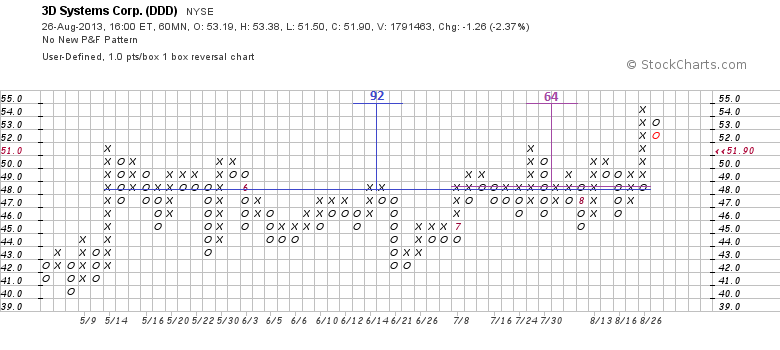
The medium horizon 1-box reversal P&F chart gives two horizontal counts from the handle part of the pattern. The count of 92 from the overall 3-month consolidation is a long shot, so I would keep in mind as a reference point the count of 64 from the July-August part of consolidation.
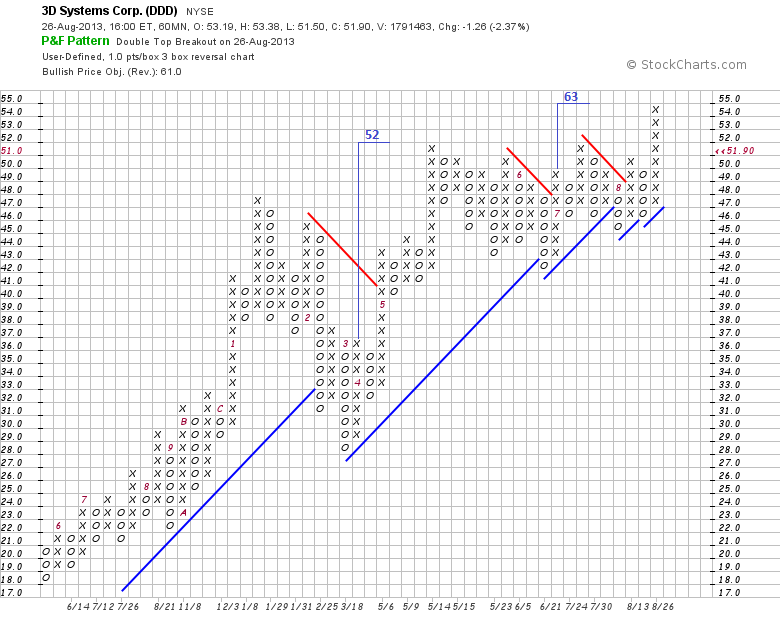
The vertical count from the June low on the 3-box reversal P&F chart gives the price objective of 63, confirming that there is some significance to the middle 60s area.
Disclaimer: I express only my personal opinion on the market and do not provide any trading or financial advice (see Disclaimer on my site).