Did you love that Bounce?
“Healthcare tanks, some names fall 40%,” said the CIO, breathless. “Materials and energy rip higher,” he continued. “You’re short emerging markets, long developed markets, your whole book is upside down.” Everything that could go wrong is. “It has to wash its way through the market, which pushes others to cover.” People question themselves, their Fed view, China, commodities, the dollar. “Some grow to see it as a turn, a buying opportunity.” Then we rally to a level where you think, hmmm, not sure. “It’s what always happens late in the cycle; and it’s nearly impossible to trade.”
(EricPeters/WkndNotes)
Do you feel better than a week ago?
I must say that while it was a relief to lift so many troubled risk assets off the floor and see buying breadth surge last week, I will need to see more to offset the damage that was done in September. The trend of weaker U.S. economic data points and early corporate earnings/commentary has led to a slide in the U.S. dollar. The Forex strength combined with some specific data points in oil and metals led to a very strong relief rally in commodities, EM currencies, and high-yield debt, all of which helped energy, materials and EM stocks globally. End of Q3 capitulation quickly led to incredible October gains for the most depressed assets. If the Fed is done talking up interest rates for this economic cycle, could this be the start of a new trend? A most painful portfolio positioning for the Q4 was to be Long: Healthcare & Consumer Discretionary Select Sector SPDR (N:XLY) and Short: Energy, Materials & Emerging Markets. For the long-term trend followers still holding these positions, they may not need to look far for a scary Halloween costume if the October trends stay in place. But the month of October is a long one with 22 trading days so stay tuned because it can bounce any direction before it is over.
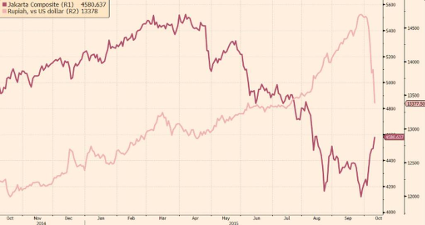
Just another week in Jakarta… Last week the Indonesian stock market was +9% while its currency was +10%.
Indonesia should send some Moon Orchids to Janet Yellen: the country’s equity market is about to finish its best week in almost six years. The Jakarta Stock Exchange Composite Index is up 2.3 per cent in late Friday trading, pushing its weekly gain to 9.2 per cent, its biggest such gain since April 2009. In US dollars the index is up nearly a fifth – 19.5 per cent – thanks to sharp appreciation in the rupiah. That makes this week the strongest one for Indonesia’s market since October 1999. On Friday alone the rupiah added 3.5 per cent, its best single session in two years. On Wednesday it rose 3 per cent. The sharp gains have little to do with developments within Indonesia though. Instead, it’s all about the Fed. Since last Friday’s weak US jobs report the idea that the central bank will leave interest rates at record lows has gained traction.
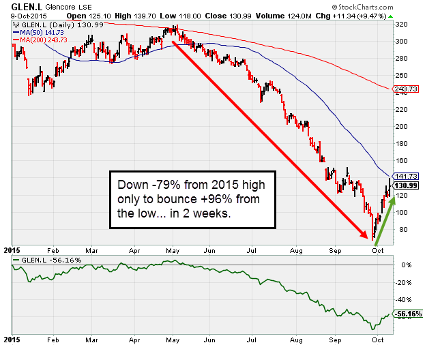
Meanwhile, Glencore (L:GLEN) elected to cut back on production and start selling assets as it fights for survival…
Zinc prices surged to a three-week high Friday after the world’s largest miner of the metal, Glencore PLC, announced production cuts equivalent to around 4% of the world’s total annual supply. But analysts said the longer-term outlook for zinc remains shaky, amid ongoing concern about the strength of demand for the metal used primarily in steelmaking. Glencore earlier said it would cut its annual zinc production by 500,000 metric tons, including closing its Lady Loretta mine in Australia and Iscaycruz mine in Peru.
So while Zinc prices jumped (along with every other industrial metal), Glencore investors doubled the stock price off the lows. Of course it is still -50% for 2015 while it fights bankers at every turn…
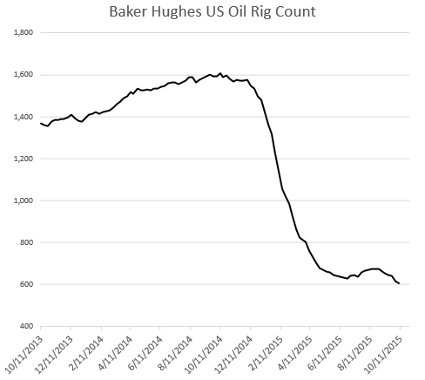
Crude Oil is getting help from 1) U.S. dollar weakness, 2) Russia’s visit to Syria and 3) increasing data points that U.S. production will eventually curtail…
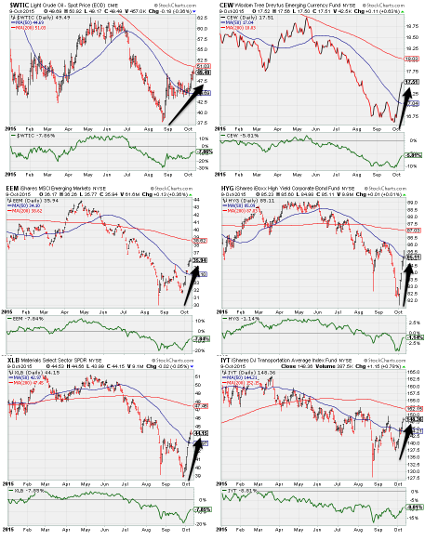
Oil, EM Currencies, EM Stocks, Junk Bonds, Energy, Material & Transport stocks are trading as mirror images of each other…
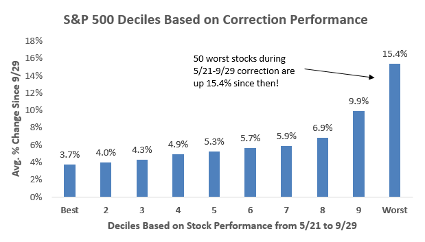
Bespoke posted a great chart showing just how wild this bounce has been for the bottom of the barrel stocks…
As you can see, the results are as clear as day — the worse a stock did during the correction, the better it has done since September 29th. In fact, the 50 stocks in decile 10 that went down the most during the correction are up a whopping 15.4% during this bounce! Conversely, the 50 stocks that held up the best during the correction are only up 3.7% during the bounce.
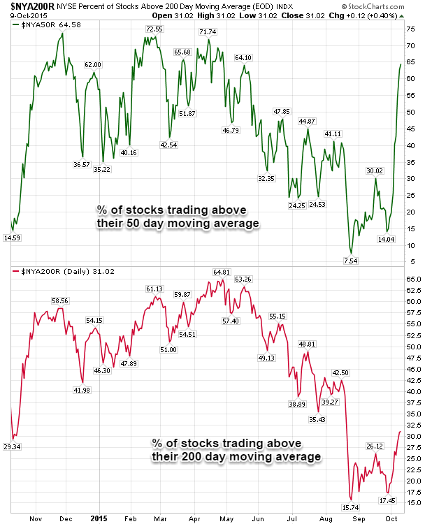
While the percent of stocks trading above their 50 day moving average has improved significantly, the percent above the 200 day MA still has a lot of work to do…
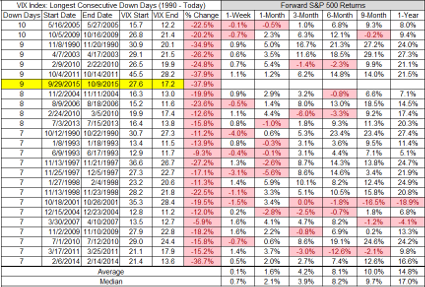
And as the market’s biggest worries have backed away from the edge, the S&P 500 Volatility Index has gone straight down 9 days in a row. Historically, this had led to further gains…
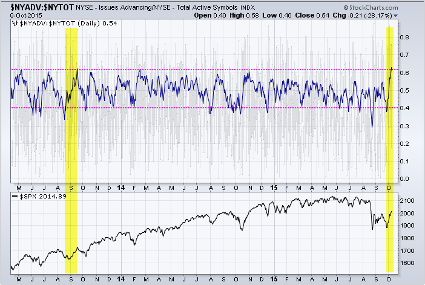
The market also got a call from Marty Zweig’s favorite indicator last week showing the very strong breadth of the move which also typically leads to further gains…
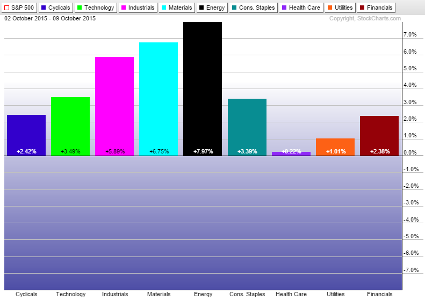
For the U.S. sectors, the week was led by Energy, Materials and Industrials while Healthcare lagged. Think PAIN trade…
Looking at the 10-week relative strength trend in all XL sectors shows Energy and Materials clawing their way out of the dirt while Health Care Select Sector SPDR (N:XLV) and Financials appear to be heading for a Halloween dirt nap…
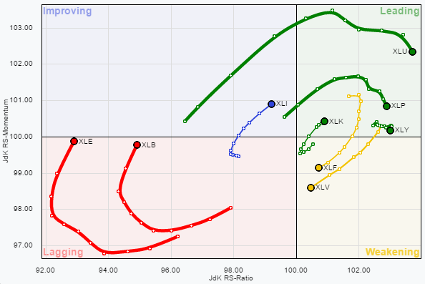
RRG charts show you the relative strength and momentum for a group of stocks. Stocks with strong relative strength and momentum appear in the green Leading quadrant. As relative momentum fades, they typically move into the yellow Weakening quadrant. If relative strength then fades, they move into the red Lagging quadrant. Finally, when momentum starts to pick up again, they shift into the blue Improving quadrant.
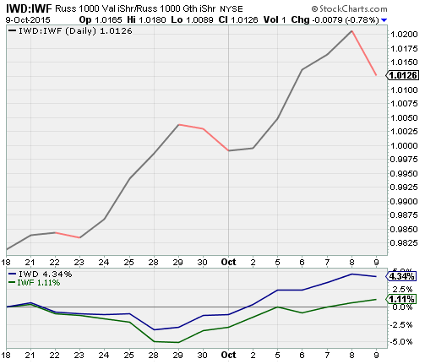
More on the rotation… While Growth has crushed Value for 16 months. Three weeks ago, that trend reversed.
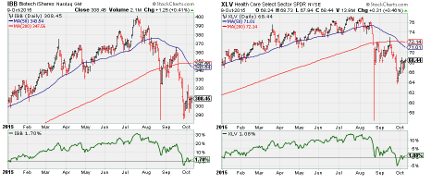
iShares Nasdaq Biotechnology (O:IBB) and Healthcare remain broken as the weekly criticism continues on drug prices and the House of Representatives remains without a speaker…
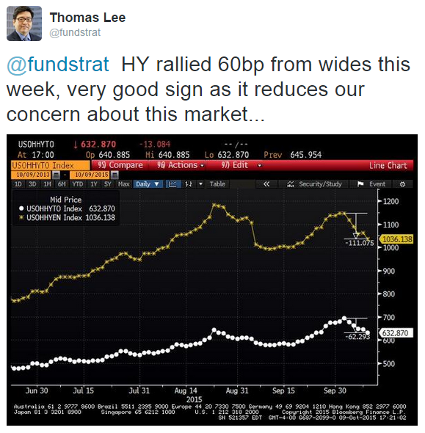
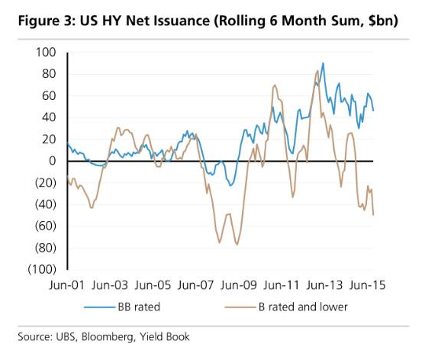
One cannot argue with the recent strong corrective move in high yield credit spreads. Equity bulls probably know daily credit spread levels better than their favorite teams’ recent football score…
Will the improvement in spreads return bond issuers to the market? Right now the worst of the Junk market is in the penalty box…
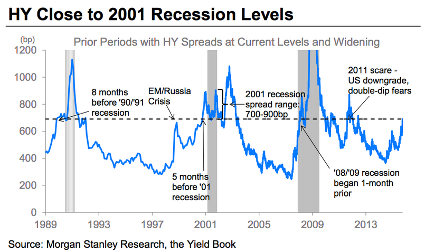
Neither UBS nor Morgan Stanley are excited with the scare in high yield spreads…
“If our analysis is correct, today’s elevated level of US investment-grade and high-yield credit spreads will persist, and default rates may rise materially through 2016,” UBS’s Stephen Caprio said on Wednesday. “The implication for the US economy is that wide credit spreads and ascending downgrade and default risks will increase borrowing costs for US corporates. This signals a downside growth risk to the US economy.”
“US high yield credit has faced one headwind after the next — from significant distress in Energy, to risks of weakening global growth, to significant uncertainty around Fed rate hikes,” Morgan Stanley’s Adam Richmond said on Friday. “As a result, HY just posted the weakest four-month stretch (Jun-Sep) since the end of 2008, -7.03% in total return. This selloff has driven very negative sentiment, as nothing brings the bears out of hiding more so than low prices, feeding into panicky price action in markets… The simple point — it doesn’t happen often — only shortly before recessions or during major growth scares,” Richmond said.
Meanwhile, more economists are moving to the sidelines on near-term Fed interest rate increases…
@DianeSwonk: The Fed’s inability to reflate economy is of concern to FOMC members and a major issue for how trajectory of rates is likely to play out
@DianeSwonk: The consensus for lower for longer on rates is very strong, acknowledging that Fed forecast has to be taken with large grain of salt
@DianeSwonk: Look for Fed to revisit how it talks about inflation target next year; Fed consensus inflation could run a little hotter than 2% is growing
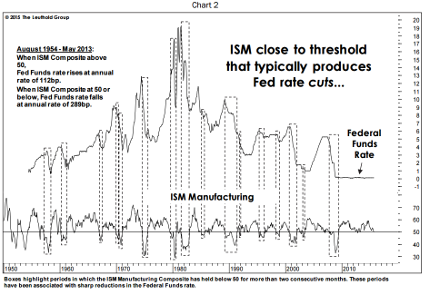
Leuthold says that the pullback in the ISM will further delay rate liftoff…
Sentiment aside, there’s new fundamental support for the Fed to delay any rate hike. Prior to ZIRP, the ISM Composite Index, Chart 2, provided one of the best forecasts of Fed policy available: the neutral 50 level is the dividing line between a stance of ease or restraint. If the stock market hasn’t sufficiently scared the Fed into inaction, the September ISM reading of 50.2 should do the trick.
(Leuthold Group)
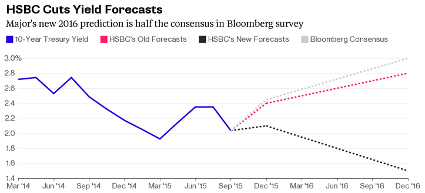
One of the top interest rate forecasters is crushing his interest rate outlook…
Steven Major is counting on the Federal Reserve to help him repeat history. The London-based head of fixed-income research at HSBC Holdings Plc (L:HSBA), who stood out in 2014 by correctly predicting that U.S. 10-Year Treasury yields would fall, cut his end-of-2016 yield forecast to just 1.5 percent, from 2.8 percent previously. That once again puts him at odds with the consensus, with the median of 60 economist predictions compiled by Bloomberg giving a reading of 3 percent… “We are less convinced that the Fed will deliver the tightening anticipated,” he wrote in an e-mailed report dated Thursday. “Our lower yield views are part of an international story, one that sees the ECB stuck in dovish mode well beyond the end-2016 forecast horizon and headwinds from some emerging markets.”
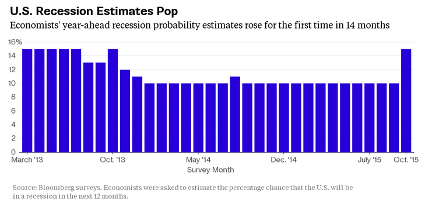
And while it may be tough to imagine a recession hitting the U.S. in 12 months, the estimates for one occurring are now on the rise…
The probability that the world’s biggest economy will enter a recession in the next 12 months jumped to 15 percent, its highest level since October 2013, according to economists surveyed Oct. 2-7 by Bloomberg. The median had held at 10 percent for 13 consecutive months.
Not helping the outlook for a slowdown were last week’s earnings disappointments and outlooks from Illumina (O:ILMN), Yum! Brands Inc (N:YUM), Adobe Systems Incorporated (O:ADBE), Nu Skin Enterprises Inc (N:NUS), Dominos Pizza UK and IRL Plc (OTC:DPUKY), Alcoa (N:AA) and Monsanto (N:MON). The international markets remained a problem for many outside of just the forex translation. Two specific comments:
Ilumina – “Geographically, we were disappointed with instrument sales in Europe and continued weakness in the Asia-Pacific region”
Alcoa – “In China, Alcoa lowered its estimate for 2015 automotive production growth to up 1 to 2 percent, from up 5 to 8 percent; reduced its projection for 2015 heavy duty truck and trailer production growth to down 22 to 24 percent, from down 14 to 16 percent; reduced its 2015 commercial building and construction sales growth to up 4 to 6 percent from up 6 to 8 percent; and kept its 2015 packaging estimate unchanged at up 8 to 12 percent”.
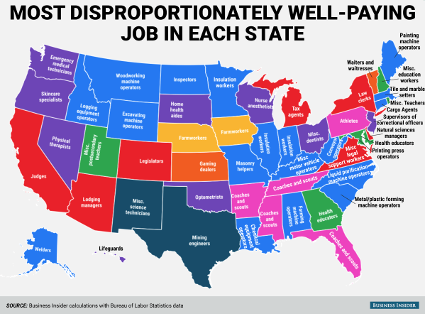
Away from the vertical stock charts last week, this was one of our favorite ‘other’ charts. If the market moves to all-time highs in October, I might be looking to apply for one of the Lifeguard positions in Hawaii very soon…
Finally, this is by far among the best news that I read all week. Go get ‘em Ladies!
Computer science has for the first time become the most popular major for female students at Stanford University, a hopeful sign for those trying to build up the thin ranks of women in the technology field. Based on preliminary declarations by upper-class students, about 214 women are majoring in computer science, accounting for about 30 percent of majors in that department, the California-based university told Reuters on Friday. Human biology, which had been the most popular major for women, slipped to second place with 208.
Have a great week and don’t forget to buckle up for the crush of Earnings Season…
The information presented here is for informational purposes only, and this document is not to be construed as an offer to sell, or the solicitation of an offer to buy, securities. Some investments are not suitable for all investors, and there can be no assurance that any investment strategy will be successful. The hyperlinks included in this message provide direct access to other Internet resources, including Web sites. While we believe this information to be from reliable sources, 361 Capital is not responsible for the accuracy or content of information contained in these sites. Although we make every effort to ensure these links are accurate, up to date and relevant, we cannot take responsibility for pages maintained by external providers. The views expressed by these external providers on their own Web pages or on external sites they link to are not necessarily those of 361 Capital.

