Get your baggage out of storage. It’s time to make summer travel plans
With the major foreign currencies down 10-35% in the last 12-36 months, 2015 will be a great year for Americans to hit the skies. A benefit to last week’s QECB announcement combined with the stronger U.S. economy has been the continued one way rip higher in the U.S.dollar. U.S. Corporations will be using the dollar strength to ramp up their foreign mergers and acquisitions. And you should use the strength to go visit Tokyo, Montreal, Reykjavik and Venice. And plan early, you know how full the U.S. outbound flights will be.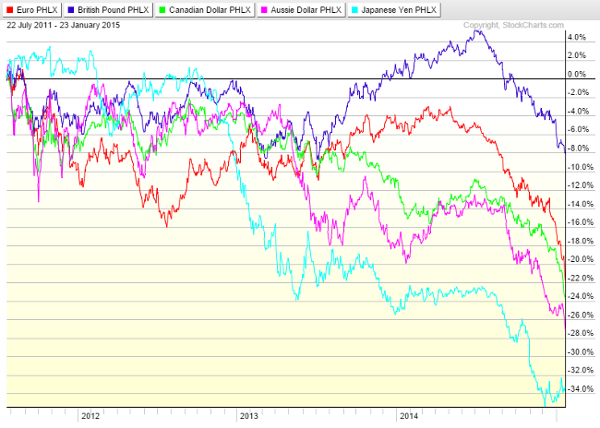
Your next best bet for a pickup in market volatility is the United Kingdom
Mark Carney has warned investors that the UK’s historically low interest rates are unlikely to continue for as long as they expect, noting that the Bank of England was closely watching the pick-up in wages… At the time of the last forecast in November, the BoE based its forecast on the assumption that the first interest rate rise would take place in October 2015, which Mr. Carney indicated at the time was a sensible assumption. Markets are now not pricing in the first UK interest rate rise until the summer of 2016 — nine months later than thought at the last forecast and later than Mr. Carney signals is now possible. He said the situation was similar in the U.S. where there was a large divergence between the Fed’s forward guidance that rates were likely to rise this year and market expectations that any tightening would be delayed. Mr. Carney warned that the difference between market and policy makers expectations could have a large impact on financial system volatility
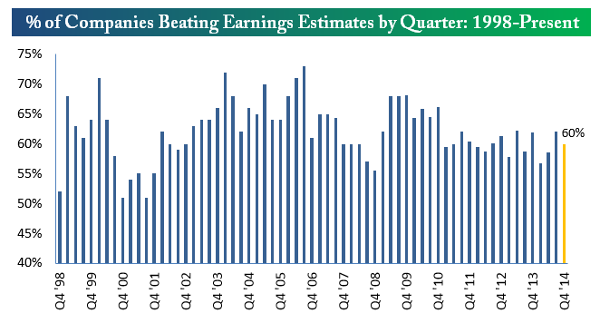
While the International markets are focused on QECB, interest rates & forex, the U.S. markets are most focused on Corporate Earnings
So far the % of earnings beats has been nothing to write home about. Pretty much a coin flip for earnings beats. Revenue beats are even trickier to nail given the large shifts in foreign currency translations, so probably a good thing that stock reactions to earnings have been more on the positive sign. But stay tuned as we still have 2 big weeks of S&P earnings left.
The new all-time high lists continue to be dominated by Healthcare, Utilities, REITs, and Airline stocks
Look at the 1 year performance numbers for these groups. You could assume 20%+ returns in Healthcare are a frequent occurrence, but to be beat handily by the bond proxies? And I hope that you have a slug of Airline stocks in your client baskets to take advantage of the ongoing plunge in oil.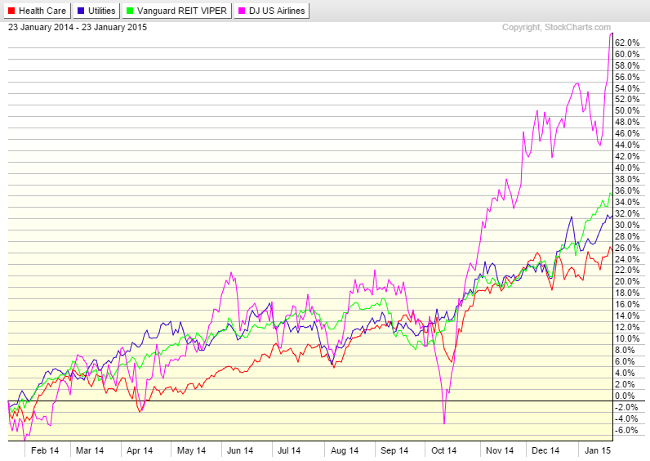
For the week, all sectors rose with Tech and Industrials leading the way as their sectors were heavily earnings news driven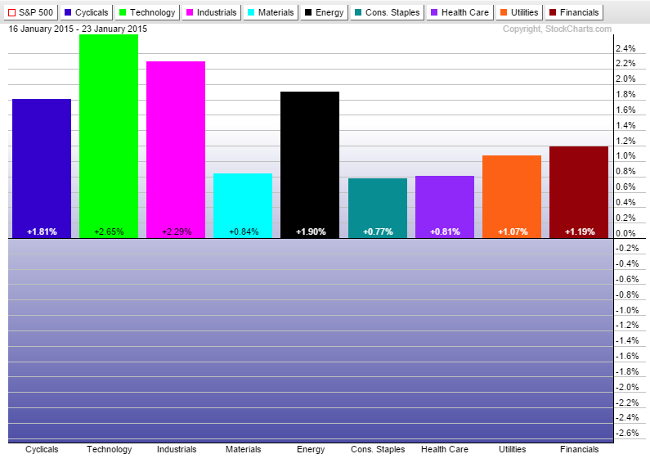
More broadly, you couldn’t find many negative returns in the world as a U.S. based investor. Even with the U.S. dollar rising, most all Developed and International investments finished in the green. Commodities led by Oil continued in their negative direction.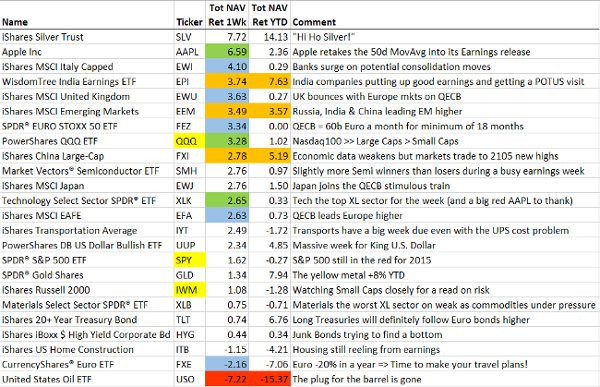
As the market chews through earnings, also some incremental real estate data
Architecture Billings Index: Dec’s ABI increased to 52.2 from 50.9 in Nov. AIA Chief Economist Kermit Baker said, “Business conditions continue to be the strongest at architecture firms in the South and the Western regions. Particularly encouraging is the continued solid upturn in design activity at institutional firms, since public sector facilities were the last nonresidential building project type to recover from the downturn."
but will the rapid changes in the U.S. dollar and energy prices affect trophy property buying patterns?
This year, 2,386 newly built Manhattan luxury condos will be listed for sale, the most on record, data compiled by Corcoran Sunshine Marketing Group show. The brokerage defines luxury as units priced at more than $2,300 a square foot… With the increased supply, buyers are taking longer to make deals. New and resale apartments that went into contract in the fourth quarter for $10 million or more spent an average of 147 days on the market, almost twice as long as a year earlier, according to real estate website StreetEasy.com. Weakness in economies outside of America, a plunge in oil prices and surging dollar may be hurting demand from international buyers, who have set records in their hunt for trophy American real estate as a haven for their money. The U.S. dollar has strengthened against all of its 16 major peers except for the Swiss franc in the past 12 months. While foreigners account for about 15 percent of total Manhattan sales, they make up about 30 percent of high-end condo purchases, according to Miller
Helping the Airline stocks to take flight last week was a commitment by the companies to pass fuel savings back to owners…
Delta Air Lines Inc. said it would use a projected $2 billion in fuel savings this year to pay down debt and return cash to shareholders, the latest evidence that U.S. carriers are using the windfall from cheaper oil mainly to retool balance sheets rather than reduce airfares. “The first order of use is to continue to reduce our net debt, and the second order of use will be higher cash returns for our owners,” said Richard Anderson, chief executive of the No. 3 U.S. airline by traffic, referring to the expected fuel savings. He spoke on a conference call Tuesday after Delta posted better-than-expected fourth-quarter results, which drove its shares up 7.3%. The spot price of jet fuel has fallen about 50% over the past five months, saving airlines hundreds of millions of dollars on their biggest expense
And while Airlines get cheaper as earnings soar, Energy companies are becoming more expensive while earnings plunge…
The current forward 12-month P/E ratio for the Energy sector is now well above the three most recent historical averages: 5-year (12.0), 10-year (11.9), and 15-year (13.6). In fact, this week marked the first time the forward 12-month P/E for the Energy sector has been equal to (or above) 22.4 since April 8, 2002.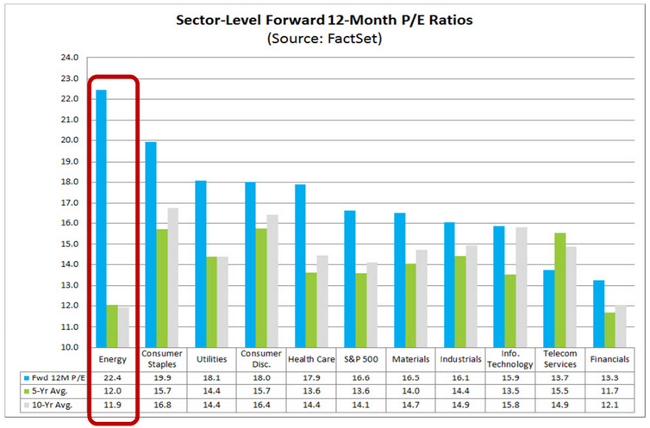
Plunging gas prices are going to fire up many consumer company revenue and earnings streams…
“Most restaurants depend on what’s happening with the middle class, and with gas prices down so much, we are seeing across-the-board increases” in sales, said David Barr, chairman of Your Pie, a fast-casual pizza chain with stores in four southern states. “Anything in quick-service dining is seeing quite a bit of the benefit,” said Mr. Barr, who also owns 23 KFC chicken franchises.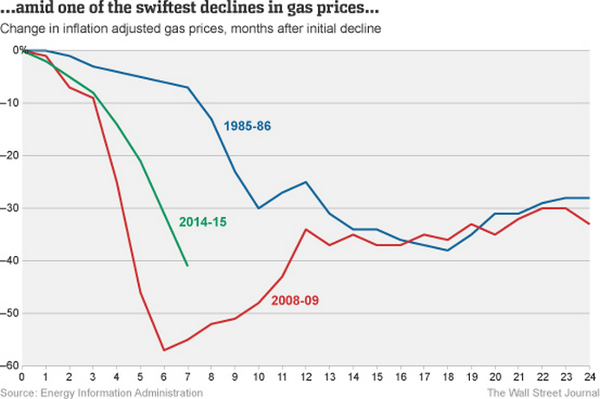
Dr. Copper needs to check into rehab as slowing global GDP and a strong U.S. Dollar continues to impact Copper prices…
Copper and commodities in general, continue to exhibit material weakness, weighing on commodity oriented economies such as Australia. Copper has recently broken through the 2.95-3.00 area that had been a lower bound on price action since 2011. When a commodity breaks through a price level that had previously been a lower bound, it can signal that supply/demand dynamics are weakening.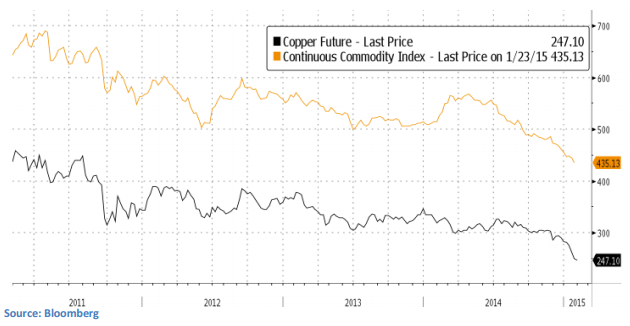
Consumer Prices should see a flow through benefit from falling commodity prices over time. But Healthcare and Higher Education costs will still be an issue to deal with…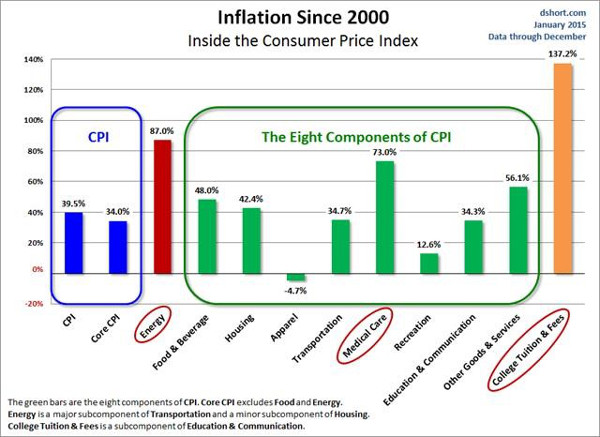
Speaking of lower inflation and falling interest rates…
BAML: There is now $7.3 trillion of negatively-yielding government debt in the eurozone, Switzerland & Japan.
SoberLook: Chart: Swiss government bond yield curve. A few months ago nobody thought such a thing is even possible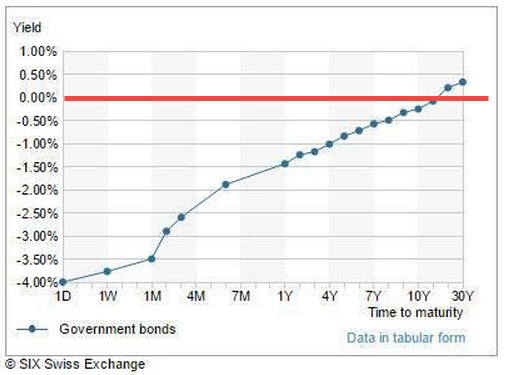
A reminder that High Yield bonds have been a good risk adjusted investment over the long term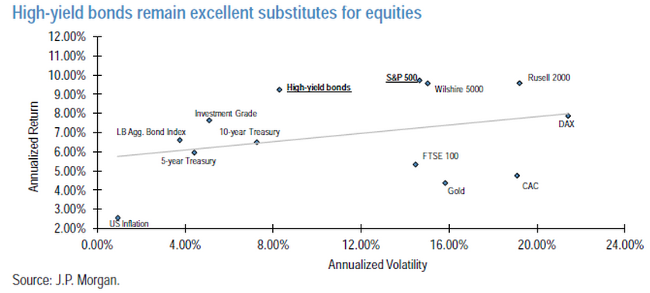
Looking at that “riskiness” of the high yield asset class in another way, investors need to remember that in a company’s capital structure, equities fall below bonds, no matter the bond rating (investment grade or high yield). This means that in any sort of difficult situation, the bonds get paid back first. Further, as the data above shows, high yield bonds have much lower risk as measured by volatility (annualized standard deviation), giving high yield bonds what we see as a significant return/risk advantage
The major High Yield ETFs are trying to put in a bottom here. If the asset class can get over this bump in Energy and not get hit by International risks, then I’d expect Junk Bonds to be moving up on many smart radar screens…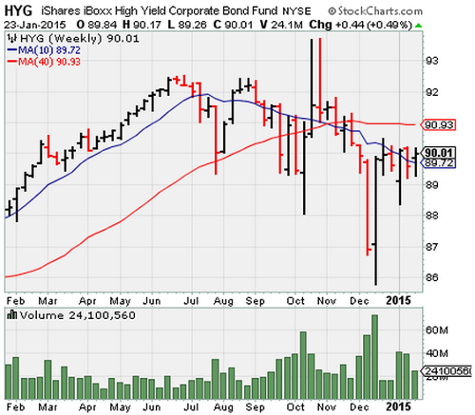
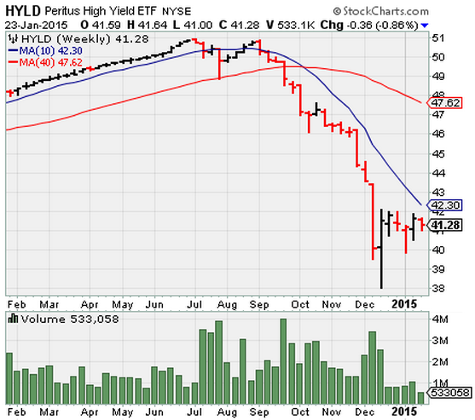
Maybe even equally important to Junk Bond’s risk/reward is that the asset class is now rather uncorrelated to Equities and Fixed Income risks…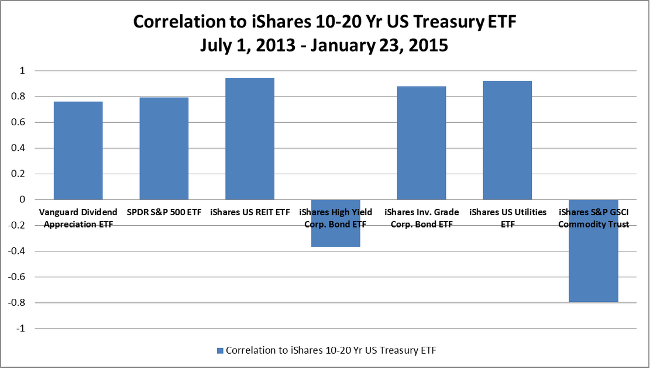
Liquid Alternative Funds beat all their Illiquid peer groups in 2014. Expect the shift from Illiquid to Liquid to continue…
Liquid alternative funds performed better than traditional hedge funds in 2014, beating them by at least 70 basis points – and in one case more than 400 basis points – across different strategies, finds Wilshire Associates. Across all investment styles, liquid alternatives returned on average 1.55% for full year 2014, based on the Wilshire Liquid Alternative Index, compared to the traditional hedge fund industry, which was down 0.58% on average based on the HFRX Global Hedge Fund Index.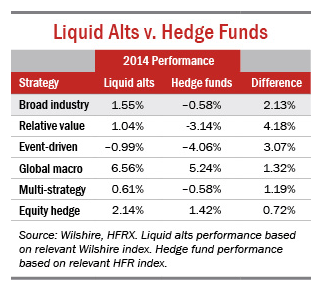
Apps > Hollywood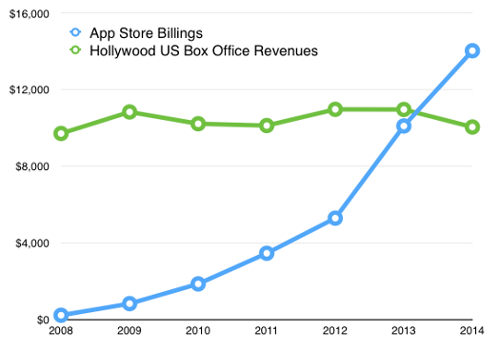
Although the totals for Domestic (U.S.) Box Office are not the complete Hollywood revenues picture, Apple’s App Store billings is not the complete App revenue picture either. The Apps economy includes Android and ads and service businesses and custom development. Including all revenues, apps are still likely to be bigger than Hollywood. But there’s more to the story. It’s also likely that the App industry is healthier. On an individual level, some App developers earn more than Hollywood stars and I would guess that the median income of app developers is higher than the median income of actors. The app economy sustains more jobs (627,000 iOS jobs in the U.S. vs. 374,000 in Hollywood) and is easier to enter and has wider reach.
Get Carl Icahn on the phone. We found him a sound asset in need of a management change…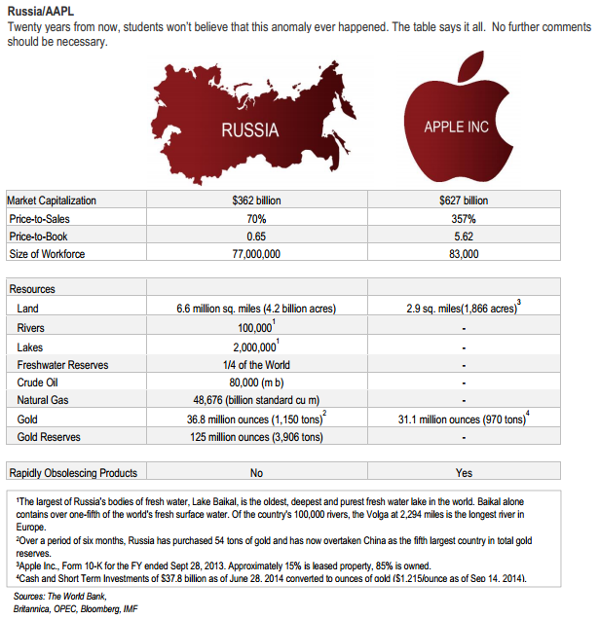
Disclaimer: The information presented here is for informational purposes only, and this document is not to be construed as an offer to sell, or the solicitation of an offer to buy, securities. Some investments are not suitable for all investors, and there can be no assurance that any investment strategy will be successful. The hyperlinks included in this message provide direct access to other Internet resources, including Web sites. While we believe this information to be from reliable sources, 361 Capital is not responsible for the accuracy or content of information contained in these sites. Although we make every effort to ensure these links are accurate, up to date and relevant, we cannot take responsibility for pages maintained by external providers. The views expressed by these external providers on their own Web pages or on external sites they link to are not necessarily those of 361 Capital.
