Should a 5+ standard deviation move in the Swiss franc be named a ‘Black Swan’ or ‘Black Cygnet’?
The big story this week was outside of U.S. stocks as the Swiss National Bank shocked the markets by announcing the removal of the EUR/CHF 1.20 floor. It also cut the rate on sight deposit account balances by 50 bp to (0.75%). The SNB highlighted the decreased overvaluation of the Swiss franc and noted that the cap had served its purpose by helping to protect the economy and giving exporters sufficient time to adjust their business models. It also pointed to international developments and the fact that maintaining the floor was not sustainable or sensible in the long run. These comments played into already elevated expectations for a sovereign QE announcement from the ECB next week. The Swiss franc rallied ~30% vs. the euro in the wake of the news, while EUR/CHF ended the week just below parity, down ~17%. Swiss stocks sold off, finishing down ~13.3% for the week with exporters leading the move lower. The dislocations drove a flurry of contagion concerns with reports of tens to hundreds of millions of dollars in trading losses at big banks, pain in the macro hedge fund community, a $225M capital hole at FXCM, the largest retail FX brokerage in the U.S. and Asia, and insolvency at UK retail broker Alpari
It will be good in the long run that the SNB decided to no longer fight the ECB…
The Good: The SNB cries mercy and comes to terms with the fact that it can’t win a currency battle with the ECB. The Swiss people have just dramatically improved the purchasing power of their savings. Also, while highly disruptive to economies and markets in the short term, maybe the cult of central banking is seeing its end of days which would ultimately be a huge positive for free markets and price discovery.
The Bad: The SNB created an earthquake for its exporters (contribute about half of GDP) and tourism industry that were planning on a 1.20 peg to the euro and now have to scramble. Over time, they should adjust both from a cost structure perspective and an FX hedging one. Until then, a sharp economic slowdown is likely. Negative bond yields in Switzerland now go out 10 years as the SNB makes it poison (and hugely expensive) to hold Swiss francs. I refer to this now as impounding instead of compounding ones capital
Swiss based multinationals will see their earnings hit, but expect them to go on acquisition sprees with their more expensive currency…
@finansakrobat: Morgan Stanley: “A 10% strengthening of the CHF vs Nestle’s total currency basket would imply around 10% downside to EPS, we estimate.”
Expect to see many spilled ‘biers’ in the hedge fund world from the SNB move…
Marko Dimitrijevic, the hedge fund manager who survived at least five emerging market debt crises, is closing his largest hedge fund after losing virtually all its money this week when the Swiss National Bank unexpectedly let the franc trade freely against the euro, according to a person familiar with the firm. Everest Capital’s Global Fund had about $830 million in assets as of the end of December, according to a client report. The Miami-based firm, which specializes in emerging markets, still manages seven funds with about $2.2 billion in assets. The global fund, the firm’s oldest, was betting the Swiss franc would decline, said the person, who asked not to be named because the information is private
There will be many other hedge fund closings and rough January reports as so many Funds were borrowing/shorting the Swiss franc…
@ReutersJamie: Ouch. Hedge fund/spec short Swissie position on CFTC last Tuesday was biggest since June 2013. Two days later…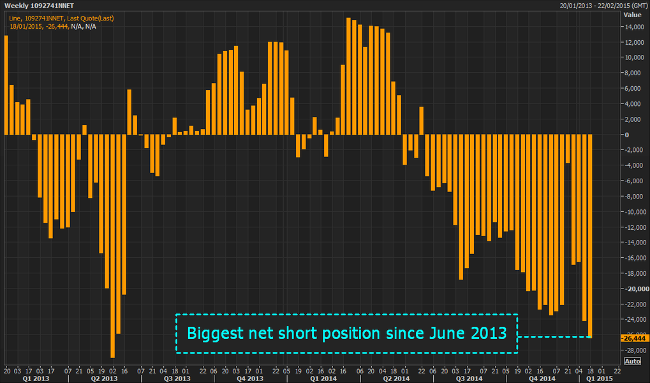
Meanwhile, Swiss stocks took it on the chin as their foreign earnings get deflated and the local economy is likely to slow…
@JLyonsFundMgmt: An All-Time 1st?: Swiss Market Index Goes From 52-Week High To 52-Week Low In Same Week!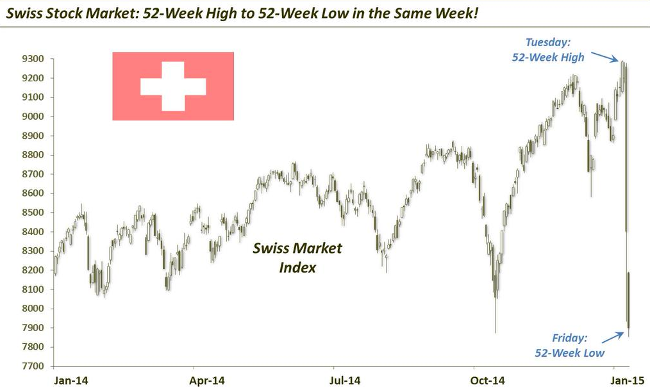
Another casualty of the SNB move is now negative short rates across Europe…
Several European countries are now experiencing negative nominal yields on their government debt. Germany, Switzerland, Austria, Finland, and the Netherlands all have 5-year bonds yielding negative interest rates. The sharp drop in the Swiss 5-year rate in January is due in large part to the SNB’s decision to eliminate the peg to the euro, but Swiss 5-year rates were already trading at roughly 0.0% before the peg was removed. 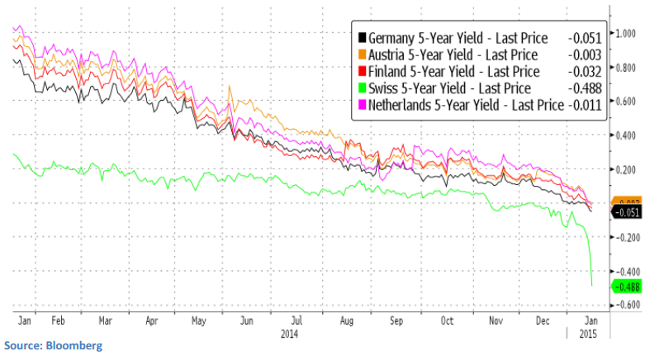
And as rates go negative, investors looked to move their assets elsewhere –> such as into euro equities…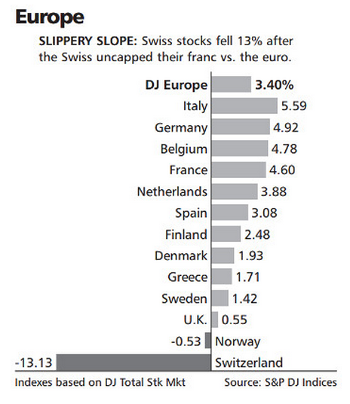
As a result, the German DAX looks like one of the most interesting markets in the world again. Even outperforming the S&P 500…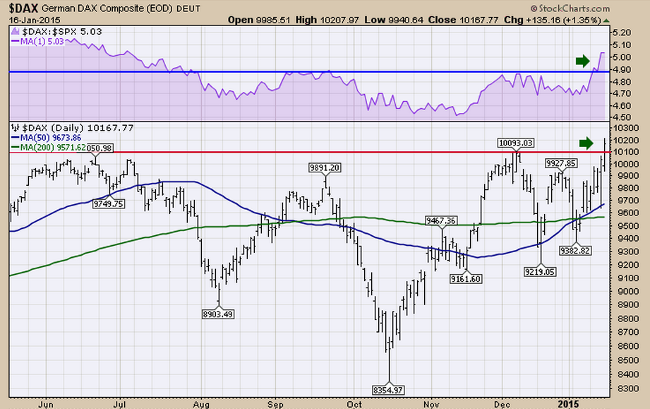
From the Swiss franc cygnet to the Crude Oil cygnet, American’s are saving wads on gasoline…
Compared to the first week of 2014, Americans are spending $2.4 billion less each week on gasoline. That’s about $7.50 per week for every person in America.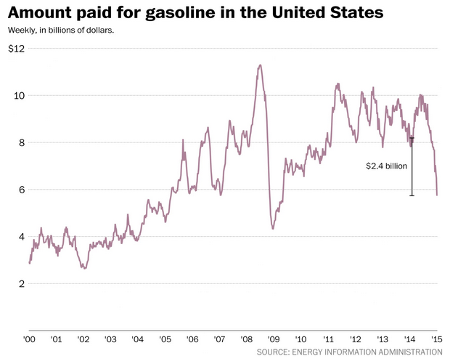
And of course the savings multiply as you move beyond gasoline and into the residences in cold weather climates…
Just last week, the federal Energy Information Administration estimated that the typical American household would save $750 because of lower gasoline prices this year, $200 more than government experts predicted a month ago. People who depend on home heating oil and propane to warm their homes, as millions do in the Northeast and Midwest, should enjoy an additional savings of about $750 this winter. “It may not have a huge effect on the top 10 percent of households, but if you’re earning $30,000 or $40,000 a year and drive to work, this is a big deal,” said Guy Berger, United States economist at RBS. “Conceptually, this is the opposite of the stock market boom, which was concentrated at the top.”…
Few places are more sensitive to shifts in oil prices than Maine, especially in winter. The state is dotted with struggling blue-collar towns like this one, where the economy is still reeling from the hangover from the recession, which only added to the woes created by sky-high energy prices and disappearing factory jobs. People here spend a significant proportion of their incomes on heating and transportation fuel, said Patrick C. Woodcock, who directs the governor’s energy office. He estimates the typical family will save $3,000 this year if the cost of oil remains low.
THE BEST ENERGY ECONOMICS READ OF THE WEEK: Why oil will now trade between $20 and $50 a barrel…
Until last summer, oil operated under a monopoly price regime, because Saudi Arabia became a “swing producer,” restricting supply whenever it exceeded demand. But this regime created powerful incentives for other oil producers, especially in the U.S. and Canada, to expand output sharply. Despite facing much higher production costs, North American producers of shale oil and gas could make big profits, thanks to the Saudi price guarantee.
The Saudis, however, could maintain high prices only by reducing their own output to make room in the global market for ever-increasing U.S. production. By last autumn, Saudi leaders apparently decided that this was a losing strategy – and they were right. Its logical conclusion would have been America’s emergence as the world’s top oil producer, while Saudi Arabia faded into insignificance, not only as an oil exporter but also perhaps as a country that the U.S. felt obliged to defend.
The Middle East’s oil potentates are now determined to reverse this loss of status, as their recent behavior in OPEC makes clear. But the only way for OPEC to restore, or even preserve, its market share is by pushing prices down to the point that U.S. producers drastically reduce their output to balance global supply and demand. In short, the Saudis must stop being a “swing producer” and instead force U.S. frackers into this role.
If oil pins below $50, the U.S. economy will need to shift to absorb unemployed energy industry jobs…
@fed_speak: Since the peak in NFP in Jan 2008, energy related employment has accounted for 12.4% of total job gains (<1% of total employment).
The largest oil field company started to move on jobs in the Q4 of 2014…
The world’s largest oil-field service company, Schlumberger Ltd., said Thursday that it laid off 9,000 workers late last year, reducing global head count 7%… As the first major energy company to report financial results, Schlumberger is expected to set the tone for a sector hard hit by plunging crude-oil prices. The company said it anticipates a drop in spending for new oil and gas exploration this year. Schlumberger helps energy producers drill and frack wells so they can pump more fuel from the ground. So far, those energy companies have indicated they will spend 30% to 35% less in the U.S. and Canada this year, said James Wicklund, an energy analyst at Credit Suisse.
Energy regions such as Texas will also need to adjust their local economies…
KB Home mentioned on their conference call that they have already moved to slow their oil patch exposures…
“We’re sensitive with the Houston situation, we are very watchful right now, in fact we actually pulled out of a couple of land transactions in the fourth quarter because of our sensitivity there.”
But for non-energy employed consumers, booyah! as those extra energy savings hit wallets…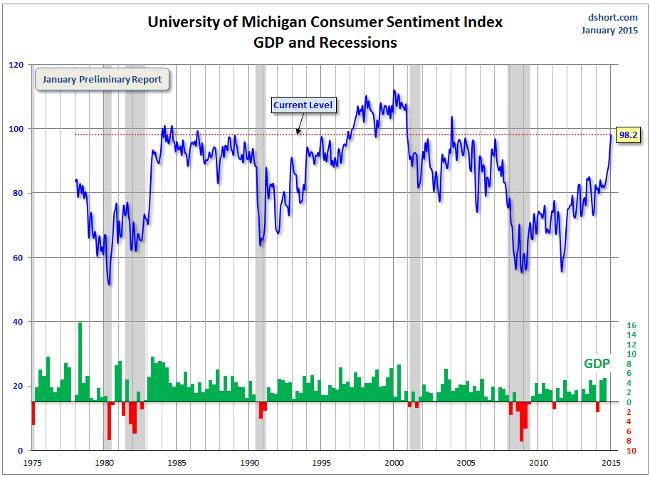
For the market, earnings season is just starting. So far, more companies have beat, but the misses by the big banks are dragging down the data…
With 7% of the companies in the S&P 500 reporting actual results for Q4 to date, more companies are reporting both actual EPS above estimates (84%) and actual sales above estimates (60%) compared to recent historical averages. However, in aggregate, companies are reporting earnings and revenue below expectations to date. The aggregate dollar-level earnings reported by these 37 companies is 0.4% below the aggregate dollar-level earnings estimated for these 37 companies.
…and the pressure is on the Q1/2015 estimates…
@EarningsScout: 40 SPDR S&P 500 (ARCA:SPY) co’s have now reported 4Q14 earnings & 62% of them had their 1Q15 EPS estimates lowered afterwards. Average estimate cut => -2.05%.
Earnings estimates have been revised significantly lower into the next 3 week’s big earnings dump. Will it be enough to hold stocks if they miss?
@ReformedBroker: S&P 500 earnings growth estimates get slashed before every quarter – but not like this. Chart via BAML Quant Strategy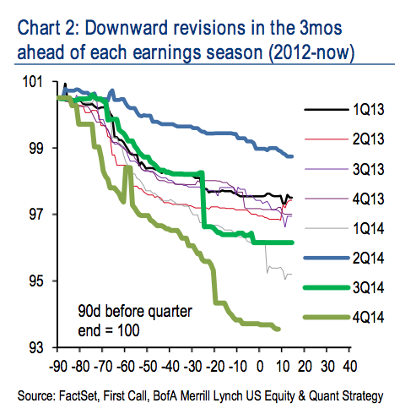
KB Home fired a nail gun at their investors as they talked higher incentives and more difficult margins…
KB Home on call spoke to softening demand pressuring pricing and higher costs. Q4 gross margin fell 30 bps QoQ to 18.7% vs. guidance for sequential improvement. Lower than expected deliveries hurt leverage, led to higher incentives and lower prices; company also cited higher construction and material costs.
As a result, comany does not expect to hit its 20% long term gross margin target in 2015. KBH also warned about Q1 results; sees Q1 gross margin down significantly YoY, setting a low point for the year then improving sequentially through FY15.
(Briefing)
And while they transport a lot of energy, the CSX railroad, moved to talk up the rest of the U.S. economy if oil prices keep falling…
“There’s been some studies that come out that essentially only 10 states have employment that’s directly impacted by the oil boom. It’s less than 2% of the U.S. population. For us, the crude by rail is less than 2% of our business. For the average U.S. person, it’s like getting a tax break of almost $2,000 a year, so it puts a lot of dollars into the economy. From any indication that we see, it’s a positive experience for the American taxpayer, for the American economy, so I think lower crude oil prices is very positive for our economy and very positive for CSX.”
No one closer to a gas station customer than Monster Beverage and they are seeing a pickup…
“There has been a pick-up, as you’ve seen, of late. Whether that’s consistent w/lower oil prices, I don’t know but we are seeing a much healthier direction at the moment and hope that will continue next year.”
(Monster analyst meeting last week)
On to Europe, Morgan Stanley shows that while falling oil prices are rough for the energy companies, 80% of the market will see a big benefit…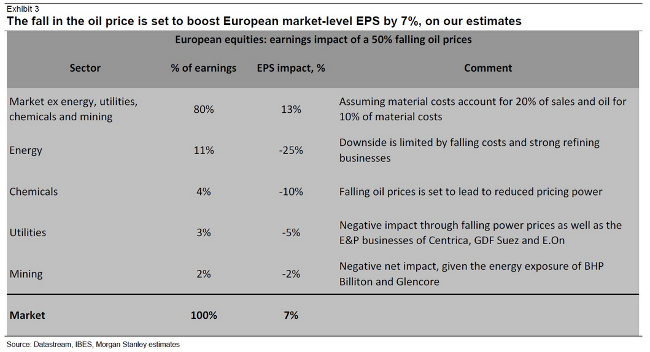
For the week, Utilities led the U.S. sectors as they followed Bonds higher (and energy prices lower?). Financials led lower as big bank earnings disappointed, the yield curve flattened and the White House unveiled new initiatives to charge banks.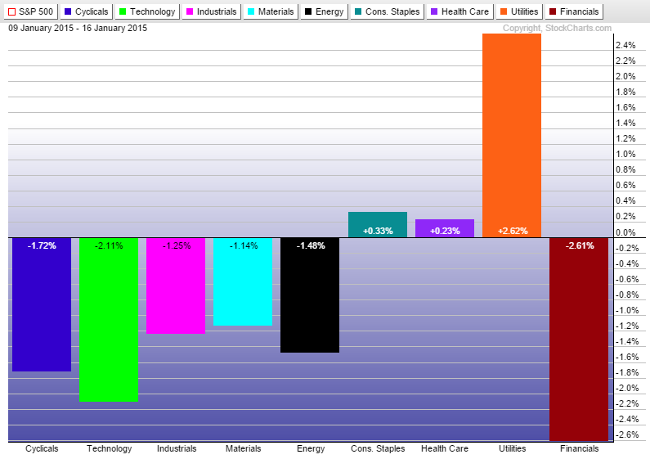
More broadly, gold led assets on the SNB moves. Europe moves higher on hopes that the ECB will take action this week. Housing and Financials led on the downside.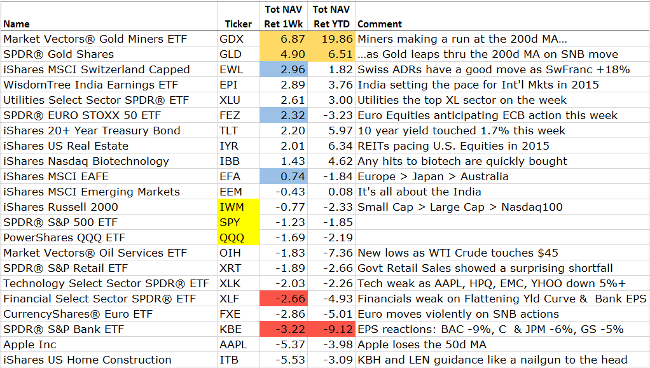
Expect a call from your banker or mortgage broker. One benefit to global yields moving negative is a cheaper mortgage rate is coming your way…
The moribund mortgage market suddenly sprang back to life last week after a drop in interest rates to levels not seen in almost two years sent borrowers rushing to lock in cheaper loans. Mortgage applications rose a seasonally adjusted 49% in the week ended Jan. 9 from the previous week and 30% from a year ago, according to data from the Mortgage Bankers Association. Application volume touched its highest level since August 2013, with most of the increase driven by borrowers seeking to refinance. 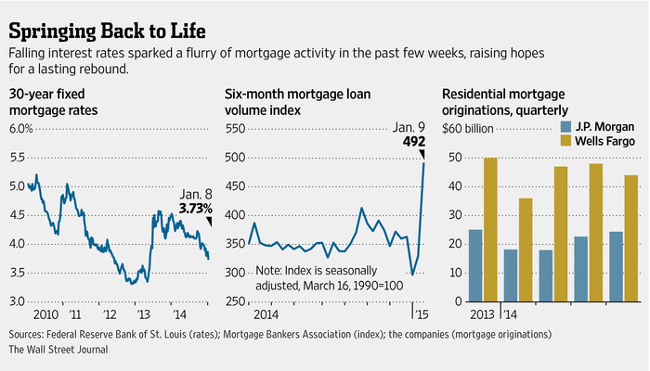
Disclaimer: The information presented here is for informational purposes only, and this document is not to be construed as an offer to sell, or the solicitation of an offer to buy, securities. Some investments are not suitable for all investors, and there can be no assurance that any investment strategy will be successful. The hyperlinks included in this message provide direct access to other Internet resources, including Web sites. While we believe this information to be from reliable sources, 361 Capital is not responsible for the accuracy or content of information contained in these sites. Although we make every effort to ensure these links are accurate, up to date and relevant, we cannot take responsibility for pages maintained by external providers. The views expressed by these external providers on their own Web pages or on external sites they link to are not necessarily those of 361 Capital.
