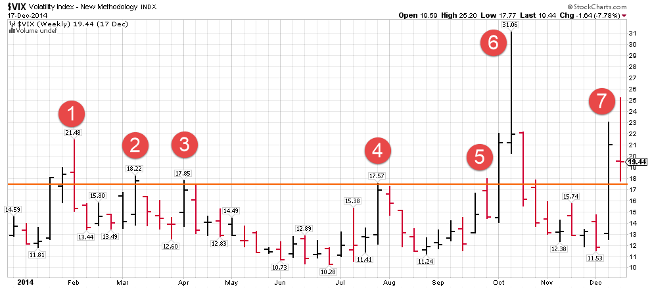
As the year winds down, I found it interesting to itemize the Volatility Spikes for 2014 in the chart below…
1) Argentinian Peso, Turkey banking, Kiev riots, China’s weak economic data, Frozen U.S., Apple Inc (NASDAQ:AAPL) EPS miss
2) Ukraine/Russia, China’s weak economic data, GM ignition issue
3) Nasdaq, Small Cap sell-off
4) Malaysian Air downed over Ukraine, High Yield bond fund outflows, Yellen hates Biotech/NASDAQ stocks
5) Small Cap underperformance, High Yield breaks, US Dollar surging, Energy rolling over, Ebola
6) International Markets break significantly lower, Europe economic data weakening, Early U.S. EPS misses
7) Falling Oil, Oil stocks, Oil countries, Very strong U.S. economic data v. interest rate concerns, Credit spreads ripping higher
Note the repeat offenders: Russia/Ukraine, High Yield Bonds, China’s Economy. What will cause the spikes in 2015?
“When the time comes to buy, you won’t want to.” – Walter Deemer
I am fielding many questions from professional and non-pro investors regarding when to step in and BUY energy stocks. While the commodity complex, oil stocks, and oil-heavy country ETFs are having a strong bounce this week, I must agree with Walter. When so many are asking, it is rarely the bottom. Given the extent of the damage, there are many who have yet to reduce their positions and will likely be using rising prices to take chips off the table. These charts illustrate previous significant declines. The current actions by OPEC have created a current significant decline. Be prepared to be early if you are bottom fishing today.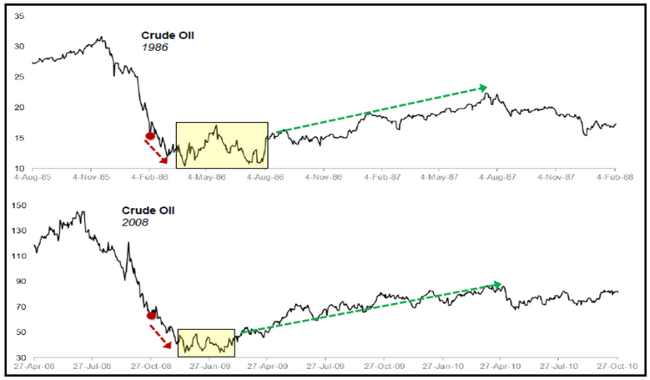
When energy stocks (and oil) finally bottom, the low is likely to be tested one or more times, as this chart from Larry Jeddeloh’s superb The Institutional Strategist shows. (This is true even if Tuesday was the low, which is doubtful.) There isn’t going to be just one fleeting moment; in other words, to buy energy stocks near the lows
Reflecting on 2014…
It was a good year for U.S. Equities. It was a great year for U.S. Bonds, the U.S. Dollar, Biotech, and Semiconductor Stocks. It was a lousy year for many asset classes, geographies, and sectors. For a U.S. investor, 2004 was a year to grab some decent returns in safe, large U.S. stocks and bonds while avoiding the several 2 feet deep potholes. A year ago we thought Global Equities were the best place to invest while Long Fixed Income was the asset to avoid. Few would have bet that the Long Treasury ETF (iShares Barclays 20+ Year Treasury (ARCA:TLT)) would have 2x the return of the S&P 500 (SPDR S&P 500 (ARCA:SPY)). And who would have thought that OPEC would collapse and Oil would have a ’5′ handle. The ongoing Jobs recovery continued to be supportive of the S&P 500 and Transportation stocks continued to confirm the Dow Industrials strength. Housing demand remained missing as did interest in Bank and Industrial stocks. We shall see what cards we are dealt in 2015 and will continually be looking forward to that next flip of the deck.
Stay flexible, have a great year-end and thank you for all of your support.
- Blaine
As I look back through my notes for the year, here were a few of my favorite ideas, themes, and reminders…
January 2014: This chart is even more important as Energy Prices fall
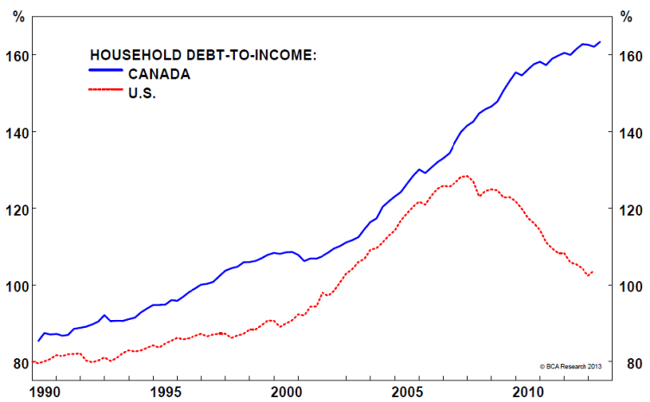
Note to Canada: Too much Household Debt and falling Real Estate prices can be bad. Really, really bad…
7.5% of the Canadian workforce is in the construction industry, while 7% of the Canadian economy is based on residential construction — both record highs;
The latest Canadian jobs report was dismal, as its economy shed 45,000 jobs in December, and the unemployment rate rose from 6.9% to 7.2%; an
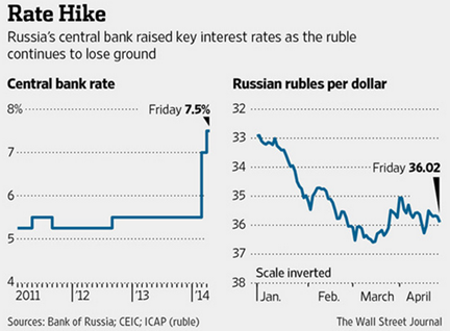
April 2014: You probably forgot that Russia increased rates from 5.5% to 7.5% in the spring. Today they are at 17%. Also the Ruble traded at 70 last week.
While Russian aggressions against the Ukraine lead the news headlines, the initial economic sanctions are starting to bite hard…
Russia’s central bank raised its key interest rate Friday, hours after Standard & Poor’s Ratings Services cut Russia’s debt ratings to one notch above junk. The moves highlight the rising economic toll of Moscow’s conflict with the West over Ukraine. The Russian economy has suffered since the crisis exploded in late February even though the U.S. and EU haven’t so far imposed the sweeping sanctions they have threatened Russia could face if it continues to undermine the pro-Western government in Kiev. Capital outflows surged to the highest levels since 2008, starving the economy of much-needed investment, and the ruble plunged, fueling inflation. Many forecasts call for growth to fall to zero this year
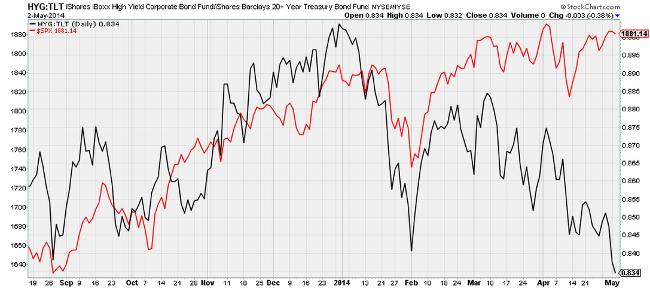
May 2014: High Yield debt has underperformed a very strong move in Treasuries all year. This was a main tell of a more difficult risk environment starting in January. Then Small Cap underperformance in March threw up a second yellow flag.
While Treasury Prices move to highs, Junk Bond prices have stopping gaining. This should be a bit worrisome for RISK investors. The ramp in supply from the above mentioned M&A does not help.
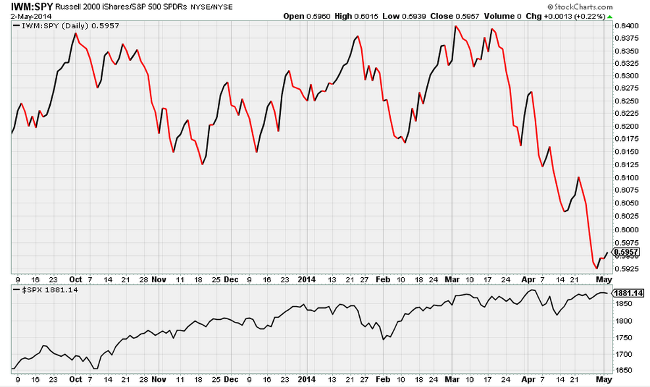
And still worrisome to RISK investors is the under performance in Small Cap versus Large Cap equities…
May 2014: In fact, Small Cap managers once again should have just gone to the beach for May thru October. Make your 2015 vacation plans now!
Leuthold Group also shows why Small Cap Managers and Analysts should take care of all their vacation time between May and October…
And if you read their Monthly research, you will also find the Presidential market cycle will give Small Cap investors a further reason to pack a big suitcase for the Summer of 2014. (I would highly recommend The Leuthold Group’s research for any Financial Advisor or Portfolio Manager. Always a helpful read for your portfolios and thought process. You can contact them at
September 2014: This was a great Global Macro call by JPMorgan. There were a few laughs back in September when it was downgraded at the lows. Well, selling the Ruble and Russian equities then definitely made someone’s 2014.
Just when you thought that Russia might be cheap enough on a valuation basis, JPMorgan sees the potential for a 50% decline…
We believe that with the significant deterioration in the Ukrainian situation, markets may treat this as a Lehman-style shock. We note there are substantial fundamental differences between the current situation and the 2008/09 crisis; the oil price is now holding up relatively well and the economic contraction may not be that deep. On the other hand, for traded stocks, the challenges and risks to investability presented by sanctions could be practically open-ended. We demonstrate that revisiting the post-Lehman lows would imply downside of 50% from an index perspective, and ~40% from the forward P/E perspective (Fig. 1 and 2).
(JPMorgan)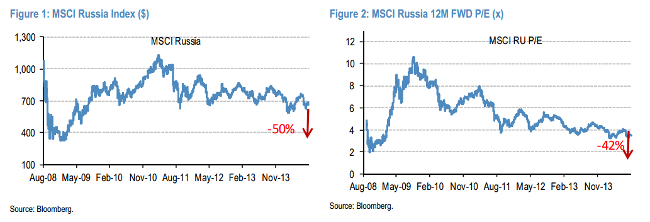
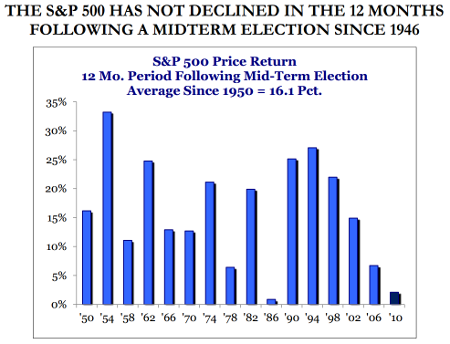
September 2014: Another good reminder of the Election cycle…
And as Congress wraps up the Q3 to suit up for re-election battle, it is important to keep in mind that the market LOVES mid-term elections…
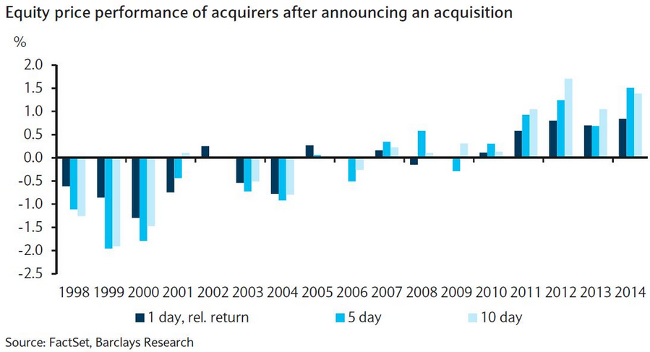
September 2014: We have commented several times about the strength of Acquirer stock prices. Still a very good sign for equities.
And as long as the Acquirer’s stock price continues to appreciate post-deal, the M&A train will only pick up further speed…
October 2014: Oil not only fell, but is still falling. Guess which sector will outperform going forward?
But for U.S. Consumers, falling Oil prices are a windfall. XLY stocks haven’t outperformed yet…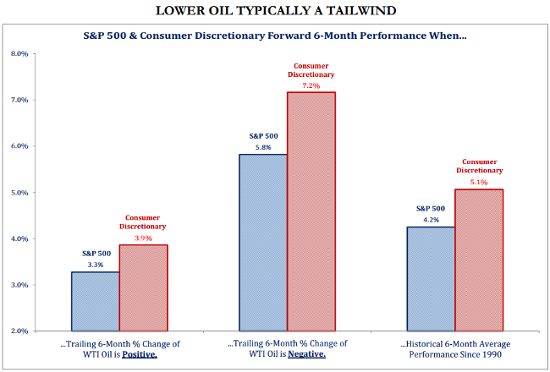
November 2014: And it still hasn’t had 4 down days in a row…
@RyanDetrick: Incredibly, $SPX hasn’t been down 4 days in a row in ’14. Since ’50, no year has ever gone a full calendar year without this happening. $SPY
November 2014: Rising credit spreads will continue to be a yellow flag for risk taking and keep volatility elevated.
One area of concern remains rising credit spreads. High Yield spreads are now UP on a year over year basis. So will Equity Market volatility follow like it has in the past?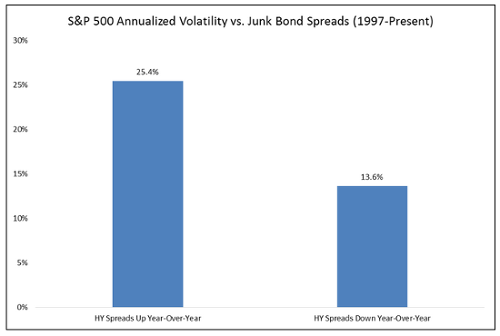
November 2014: Remember over Thanksgiving when OPEC blinked
After OPEC’s announcement, it is tough to argue that this is not the best chart of 2014…
Crude oil prices have fallen more than 30% from their highs earlier this year, and while people have attributed this tumble to many things, one thing cannot be ignored: U.S. crude oil production has been exploding. In an email Thursday, Deutsche Bank economist Torsten Slok sent around the following chart, showing the explosion in U.S. crude oil production over the past few years. Slok wrote: “The most important reason why oil prices are falling is because of the dramatic increase in recent years in U.S. crude oil production … and U.S. oil production is expected to increase further by 1 mmb/d in 2015 and 0.6-0.7 mmb/d per year in the years to 2020. In other words, expect a continued increase in oil supply going forward.”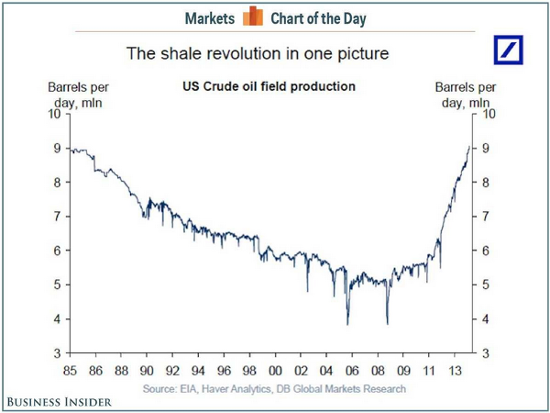
Finally for fun…
October 2014: If you have a chance over the holidays, get your kids and grandkids fired up about math. The U.S. is very short geeks right now. Plenty of good table games, board games and now tablets/computer apps to get them more interested.
Finally, help your kids to LOVE math, science & computers…
Majors that emphasize quantitative skills tend to have graduates with the highest lifetime earnings. The highest-earning majors are those in engineering fields, computer science, operations and logistics, physics, economics, and finance.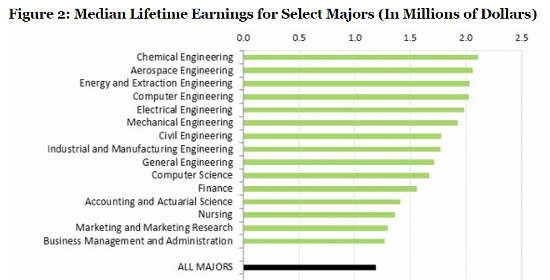
June 2014: Still one of the most interesting charts of 2014.
Bill Gates has a fascinating book recommendation…
Making the Modern World: Materials and Dematerialization, by my favorite author, the historian Vaclav Smil… He argues that the most important man-made material is concrete, both in terms of the amount we produce each year and the total mass we’ve laid down. Concrete is the foundation (literally) for the massive expansion of urban areas of the past several decades, which has been a big factor in cutting the rate of extreme poverty in half since 1990. In 1950, the world made roughly as much steel as cement (a key ingredient in concrete); by 2010, steel production had grown by a factor of 8, but cement had gone up by a factor of 25.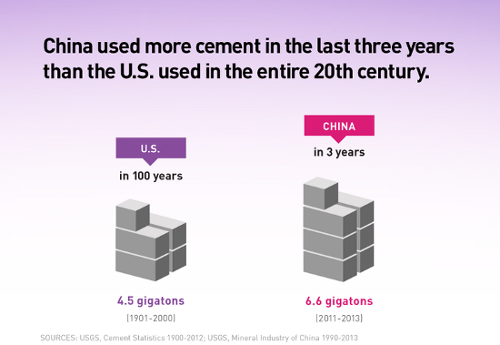
March 2014: Hands down this was 361 Capital’s most favorite book of the year.
Finally, if you have geek DNA or have a live one running around the house, get this book. We all just ripped through it and would highly recommend it. The language isn’t worse than anything in Apollo 13 or The Right Stuff so it would also make a perfect gift for any high-schooler interested in math and science.
August 2014: A good second choice by the team. Also the 2nd book, The Rosie Effect, will be out next week.
Geek Read of the Week = The Rosie Project. Hat Tip to Melinda and Bill Gates for this find. A hilarious quick end of summer read…
MEET DON TILLMAN, a brilliant yet socially challenged professor of genetics, who’s decided it’s time he found a wife. And so, in the orderly, evidence-based manner with which Don approaches all things, he designs the Wife Project to find his perfect partner: a sixteen-page, scientifically valid survey to filter out the drinkers, the smokers, and the late arrivers.
August 2014: My favorite find of 2014…
Finally, as our kids head back to school this week, here is a great quote to remember…
The information presented here is for informational purposes only, and this document is not to be construed as an offer to sell, or the solicitation of an offer to buy, securities. Some investments are not suitable for all investors, and there can be no assurance that any investment strategy will be successful. The hyperlinks included in this message provide direct access to other Internet resources, including Web sites. While we believe this information to be from reliable sources, 361 Capital is not responsible for the accuracy or content of information contained in these sites. Although we make every effort to ensure these links are accurate, up to date and relevant, we cannot take responsibility for pages maintained by external providers. The views expressed by these external providers on their own Web pages or on external sites they link to are not necessarily those of 361 Capital.

