Do you still believe in the Santa Claus rally?
If so, then this will be your week to go long the market. Investors will be looking to finish up their year-end business this week. Final tax losses are taken and trading books are cleared of ugly losers so the Holidays can be fully enjoyed. The graph and chart below illustrate the various gains posted by the 2nd half rally. Currently, each of the conditions are being met. While there is plenty of worry and volatility in the prices of Energy and Russian, Greek, Brazilian, and High Yield securities, to top the list. If U.S. Equities are truly the place to invest in 2015, then you could see the early buyers beginning to emerge this week… just as they have so many times before.
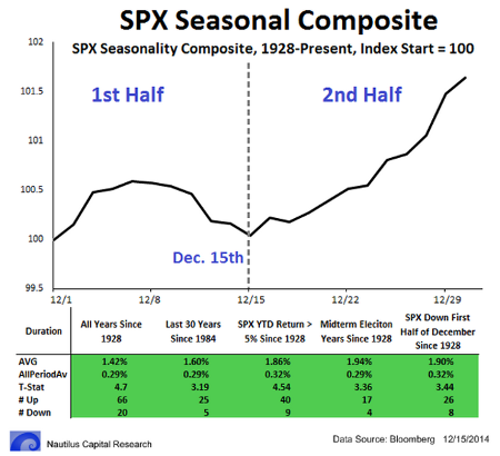
Source: @NautilusCap
Even Santa non-believers are going to get a sizable gift the next time they fill their gas tank…
American workers have been waiting years for a big raise. That bump is finally coming—at the gas pump. If prices were to stay at their current levels under $3 a gallon, the average American household could save $380 during the coming year, up from $83 since prices first declined this past summer, according to research firm ClearView Energy Partners. A separate estimate from IHS Global Insight says the average family could save $750 during the next year. By comparison, the median U.S. income grew by just $181 last year from a year earlier after adjusting inflation. The drop in gas prices has raised retailers’ hopes for a stronger shopping season, since less spending at the pump gives consumers more to spend on everything from restaurant meals to clothing and haircuts.
You thought the consumer and business surveys were showing optimism? Just wait…
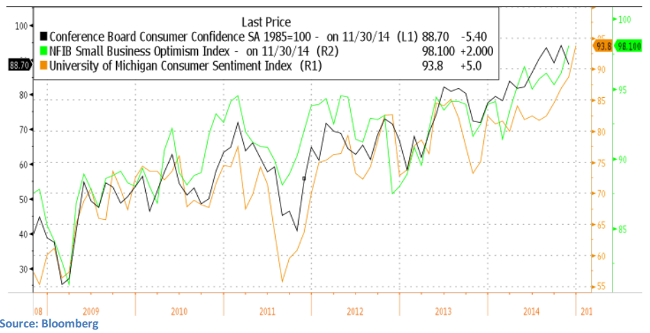
It will be interesting to see how the Fed addresses $50 Oil and how it might affect their inflation vs. rate hike discussions. For now, some are betting that the most cautious language on timing will be dropped…
Federal Reserve officials are seriously considering an important shift in tone at their policy meeting next week: dropping an assurance that short-term interest rates will stay near zero for a “considerable time” as they look more confidently towards rate increases around the middle of next year. Senior officials have hinted lately that they’re looking at dropping this closely watched interest-rate signal, which many market participants take as a sign that rates won’t go up for at least six months. “It’s clearer that we’re closer to getting rid of that than we were a few months ago,” Fed Vice Chairman Stanley Fischer said in an interview with The Wall Street Journal last week.
Energy and Commodity prices are big contributors to all-time low global Sovereign yields…
Falling oil prices should be bond market friendly as they reinforce disinflationary pressures in U.S. and U.K. and deflationary pressures in EZ.—Source:@DrGerardLyons:
U.S. long bonds continue to climb the wall of worry and remain a top investment for 2014…
U.S. 30-Year yield ends the week at 2.75%, breaking below its long-term monthly channel.—Source:@MktOutperform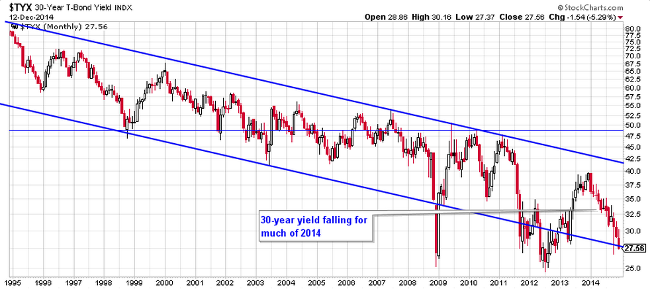
Team BTIG posted a good chart over the weekend showing another period in time when the Saudis crushed oil prices…
Something similar to today’s situation occurred in 1985 (chart below). Simply put, the Saudis chose, at the time, to continue producing oil even as the price declined. Oil ended up falling in price by nearly 70%! As the chart below illustrates, oil’s decline helped spark a 40% rally in the S&P 500 between late September 1985 and early September 1986. The market’s P/E multiple nearly doubled, rising from 10x in early 1985 to 17x by early July 1986.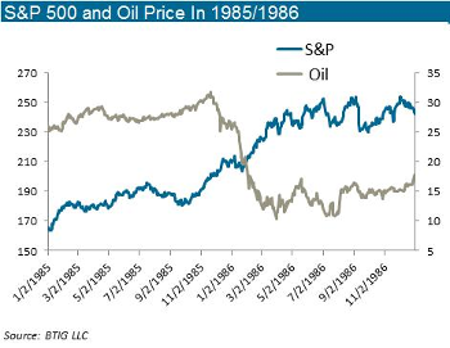
While U.S. Equities had a tough week, it is important to note which names/groups were seeing buyers…
As you would expect, new all-time highs were well represented by companies that will benefit from lower energy prices. Think about who gains when you put that extra $500 on every dinner table in America.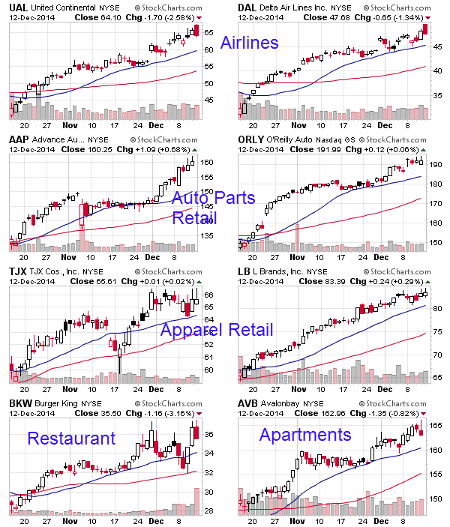
While America is looking up, things have gotten much worse for Russian and Greek equities…
Oil prices are mostly affecting Russia, while Political uncertainty is hitting Greece.
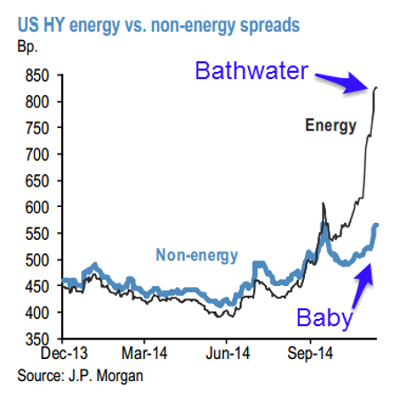
Lower energy prices continue to cause angst among High Yield investors…
U.S. HY mutual funds saw outflows of over $2.6bn (0.9% AUM) at the end week of December 10.—Source:@zerohedge
…And given the lack of liquidity in Junk Bonds, the baby is getting thrown out with the bath water.
But that is what happens in times of illiquid markets. Unfortunately, portfolio managers sell what they can, not what they should. Keep a sharp eye on credit spreads; a stabilization will be an important data point.
Investors are fleeing the U.S. junk debt market as a sell-off that started in low-rated energy bonds last month has now spread to the broad corporate debt market amid fears of a spike in default rates. The sharp drop in energy bond prices has helped push average yields on broad junk debt near the 7 per cent mark for the first time since June 2013, according to Barclays indices. The jump in yields came as redemptions from mutual funds and ETFs buying the securities more than doubled in the past week, to $1.9bn, according to Lipper… The sell-off has cast a shadow on the outlook for the $1.4tn market of weaker credit quality corporate debt, highlighting the risks to investors who flocked to bonds in recent years. “The junk bond market is having a hard time and the pressure will continue,” said Michael Kastner, managing principal at Halyard Asset Management. “There are no real buyers right now and mutual funds will keep seeing redemptions.
When so many are looking for the bottom, you know that you are not yet there…
RIP: “Oil will be here or lower for the next 6 to 12 months,” said the trader, one of the markets most talented, ready to move on. People love to buy breaks like this, choking on bargains. “Money you put into oil now is dead money, unless you’re seriously long-term.” There’s an invisible threshold in any market that once broken does something that takes a long time to digest, accept, and repair. “It’s healthy to clear out excesses of all these corrupt governments and sloppy companies that needed oil above $80 – it’s time to cull the herd.”—Source:EricPeters/WkndNotes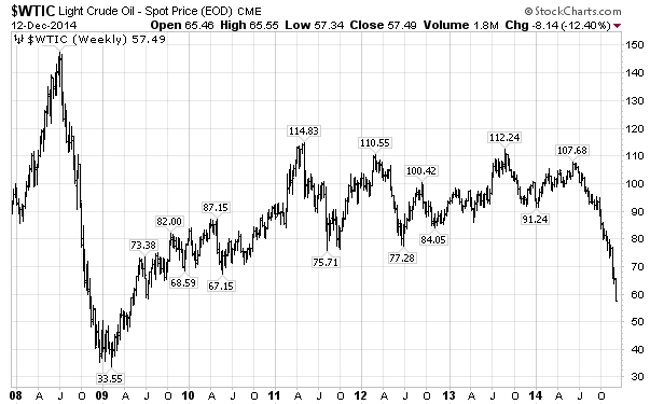
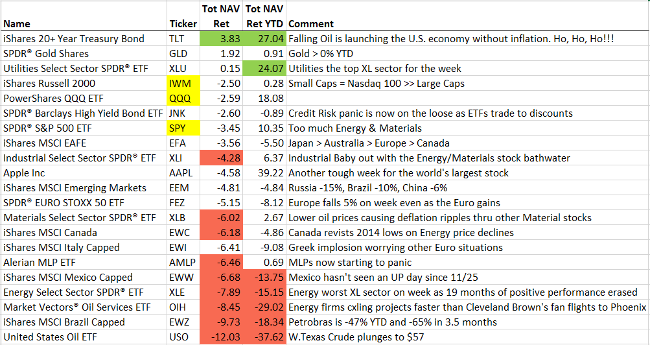
A tough week for the U.S. sectors…
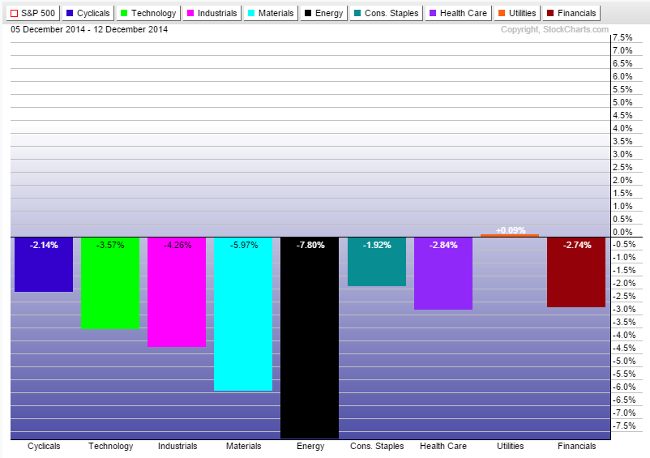
Even more broadly, only Bonds, Metals, and Utilities survived with gains. Anything remotely touching energy turned into a lump of coal.
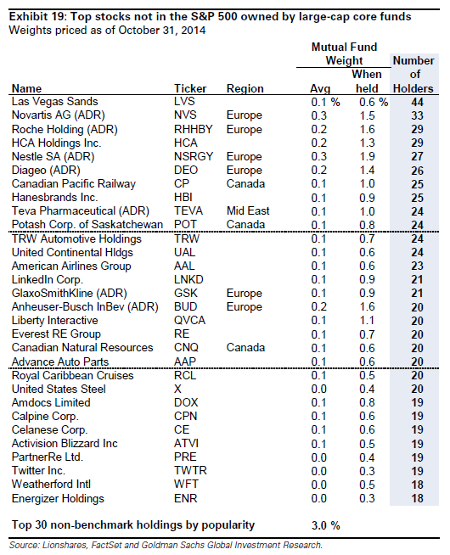
Active equity managers are looking at a terrible 2014. They could have outperformed the indexes by making sector bets, but if they were held to benchmark hugging, then there wasn’t enough dispersion within the sectors to put up big numbers…
Here is the list of non-index stocks that large cap Mutual Funds are betting on to outperform...
Wow. There are 115m U.S. households. A fair bet that Amazon revenues are going to benefit from $50 oil…
Based on estimates charted for us by BI Intelligence, membership in Amazon Prime (NASDAQ:AMZN) has spiked over the last year, and is expected to reach roughly 58 million worldwide by the end of 2014. Bundling so many services into Amazon Prime seems to be working: According to RBC data, 40% of Prime members have spent more than $200 on the website in the last 90 days, compared to only 13% of non-Prime members.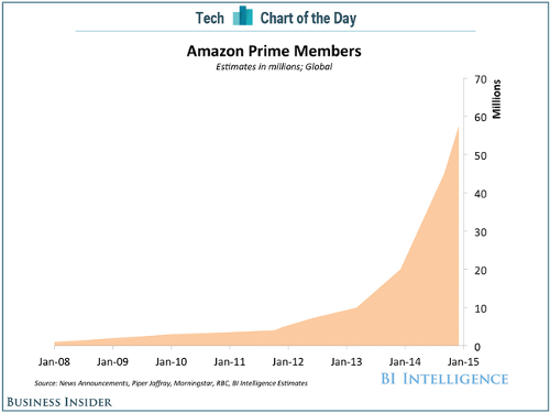
Finally, another 2015 blockbuster started filming last week…
Disclaimer: The information presented here is for informational purposes only, and this document is not to be construed as an offer to sell, or the solicitation of an offer to buy, securities. Some investments are not suitable for all investors, and there can be no assurance that any investment strategy will be successful. The hyperlinks included in this message provide direct access to other Internet resources, including Web sites. While we believe this information to be from reliable sources, 361 Capital is not responsible for the accuracy or content of information contained in these sites. Although we make every effort to ensure these links are accurate, up to date and relevant, we cannot take responsibility for pages maintained by external providers. The views expressed by these external providers on their own Web pages or on external sites they link to are not necessarily those of 361 Capital.
