Oil-Price Recovery Or 'Dead-Cat' Bounce
Since the beginning of the year Oil Prices prices (using West Texas Intermediate Crude as a proxy) have bounced from their lows following the collapse last year. Many are speculating that the "damage has been done" and now prices should begin to recover, hopefully, to much higher levels in the near future.
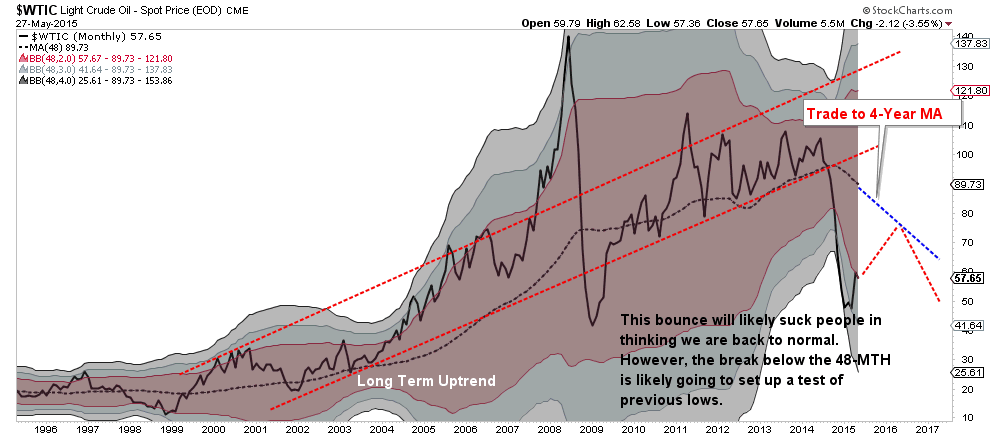
My view is somewhat different as the recent recovery in prices has all the earmarks of a technical "dead cat" bounce rather than a fundamentally driven recovery story. Let's start with the chart below, which is a MONTHLY chart of oil prices as compared to a 4-year moving average.
The break below the long-term bullish trend suggests that a tremendous amount of technical damage has been done over the last nine months, which is unlikely to be resolved in the short-term.
From an investor psychology view, many individuals were trapped by the collapse in oil prices. After buying into energy stocks near the peaks, many are now hoping for an opportunity to exit positions on the bounce. The dashed blue line shows the current downward trend of the 4-year moving average that will likely act as a confining resistance level for quite some time. Rallies in oil prices toward these levels will be met by investors looking to sell out of losing positions.
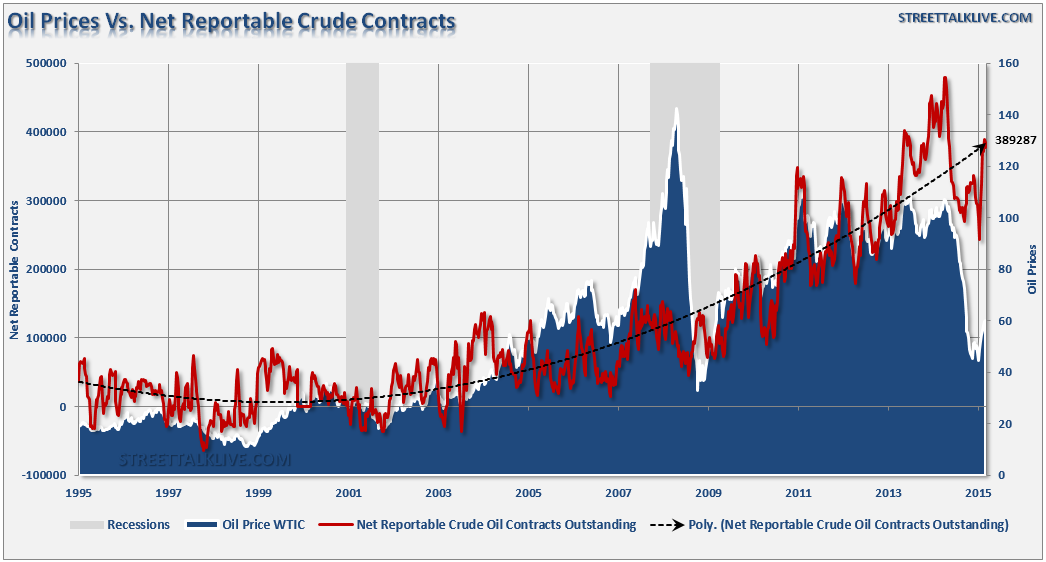
Furthermore, the number of net reportable crude contracts has surged from deeply depressed levels, which has created a "short squeeze" in the underlying commodity prices. However, the last time that net reportable contracts were at current levels, oil prices were over $100/bbl rather than $60. This data also suggests the recent bounce in oil prices is likely temporary as well.
The current level of speculation in oil prices suggests that another leg down will likely come during the summer months, particularly as supplies continue to build as global demand continues to slide.
Fundamental Backdrop
The real problem, of course, is the same one that is always faced by technical analysis -- price doesn't exist in a vacuum. There are fundamental factors that ultimately drive long-term prices. With oil, those fundamentals also suggest another drop is coming, which was discussed by Arthur Berman, via Oilprice.com, recently:
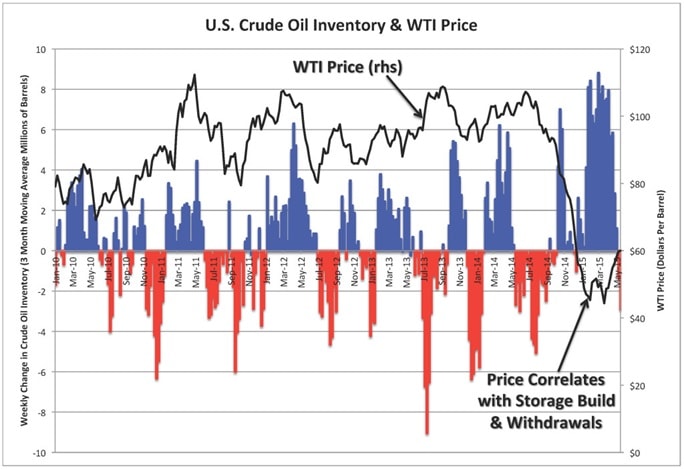
"Storage withdrawals and falling rig count have been the main sources of hope that U.S. tight oil production will fall and that oil prices will rebound. That hope is fading as it is now clear that recent withdrawals from U.S. crude oil storage are because of price, not falling supply, and that the drop in rig count has stalled.
Figure 1 below shows the relationship between U.S. crude oil storage inventory and WTI price. The thinking around recent withdrawals from storage is that this reflects depleting supply. The data, however, reflects that traders were storing crude oil during the price collapse in order to realize higher prices later. With rising prices over the last month, traders are selling their stored volumes. The recent inventory build correlates almost perfectly with the fall in oil prices and the withdrawals from storage over that last 3 weeks correlate with the 35% increase in oil prices since late March."
"Previous builds and withdrawals from inventory also correlate with price but generally price followed changes in inventory. In the recent case, price led inventory changes.
The other important point about Figure 1 is that inventory additions and withdrawals are seasonal. A Spring and Summer "de-stocking" is normal. In that sense also, the recent withdrawals from storage say less about oil supply than they do about northern hemisphere summer driving demand and the end of regularly scheduled refinery maintenance in the U.S."
The increased domestic supply of oil along with slowing global growth are major factors in oil's collapse. With debt levels globally continuing to rise, the best solution of Central Banks has been to "shuffle deck chairs on the Titanic." There is little likelihood that economic growth will re-surge in the near future to offset the drag of global insolvency. The levels of high unemployment and weak income growth are weighing on the demand side of the equation, not to mention the continued increases in fuel efficiencies and productivity through technological innovation.
While the recent spike in oil prices was sparked by lower U.S. oil-production numbers, analysis suggests that it was a temporary slowdown in Alaska, not a reduction in fracking production, that caused the rise. Inventories still remain elevated and Saudi exports are the highest since 2005. Furthermore, OPEC's 12 members will have 485 million barrels of oil in transit to buyers in the four weeks to June 6, the most since November, and Iraq, plans to boost exports to a record 3.75 million barrels a day next month, according to shipping programs.
Rise Of SuperTanker Storage
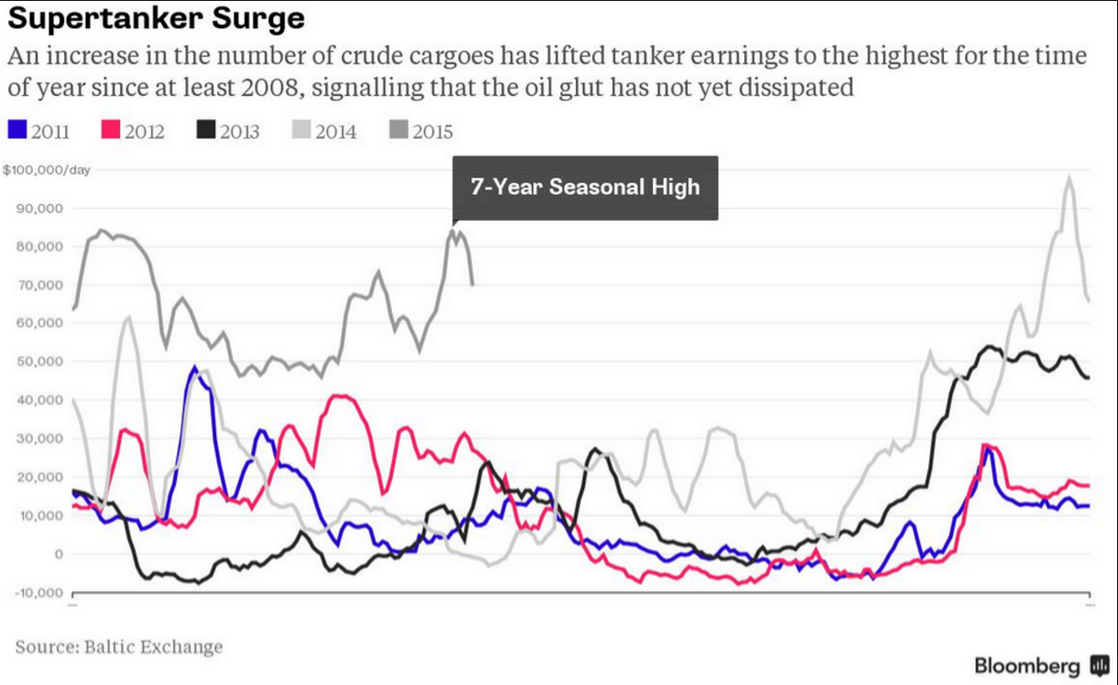
The increased supply of oil has to be stored somewhere. While many have been watching traditional storage areas such as Cushing, Oklahoma, the increase in crude cargoes suggests that oil is being held on open waters. According to a recent editioral by Bloomberg:
"The Organization of Petroleum Exporting Countries is pumping the most oil in more than two years, determined to defend market share rather than prices. A record cut to the number of active U.S. drilling rigs and billions of dollars of spending reductions by companies since last year's price plunge has yet to translate into a slump in barrels produced. The world is pumping about 1.9 million barrels a day more crude than it needs, according to Goldman Sachs Group Inc. (NYSE:GS).
Supply of oil continues to build," said Paddy Rodgers, the chief executive officer of Antwerp, Belgium-based Euronav NV, whose supertanker fleet can haul 56 million barrels of crude. "All of this oil needs to go somewhere," he wrote in an e-mail May 19.
Daily rates for supertankers on the industry's benchmark route reached $83,412 on May 20, from $52,987 on May 6, according to the Baltic Exchange in London. While rates since retreated to $65,784, they're still the highest for this time of year since at least 2008."
"The capacity of the global tanker fleet has been further constricted by investors storing oil at sea, seeking to profit from longer-dated futures contracts costing more than near-term supply. About 20 million barrels is being stored, according to the average of three estimates from analysts."
While it is likely oil prices could get a bit of a bump from a decline in the U.S. dollar, ultimately it will come down to the fundamentals longer term. It is quite clear that the speculative rise in oil prices due to the "fracking miracle" has come to its inglorious, but expected, conclusion. What is interesting is that most have not figured out that the same thing will occur with the artificially driven surge in financial markets as well. It is quite apparent the some lessons are simply never learned.


