Autos Send Economic Warning
Over the last year, or so, as economic data has materially weakened along with corporate earnings and profitability, one of the primary arguments against an “economic recession” has been the strength of automobile sales. I do not argue this point.
However, while there are continued “hopes” that this economic cycle will last indefinitely into the future, automobiles, among a variety of other economic indicators as discussed recently, are sending a clear warning sign.
Following the financial crisis the average age of vehicles on the road had gotten fairly extended so a replacement cycle became more likely. This replacement cycle was accelerated when the Obama Administration launched the “cash for clunker” program, which reduced the number of “used” vehicles for sale pushing individuals into new cars. Combine replacement needs with low interest rates and easy financing and you get a sales cycle as shown below.
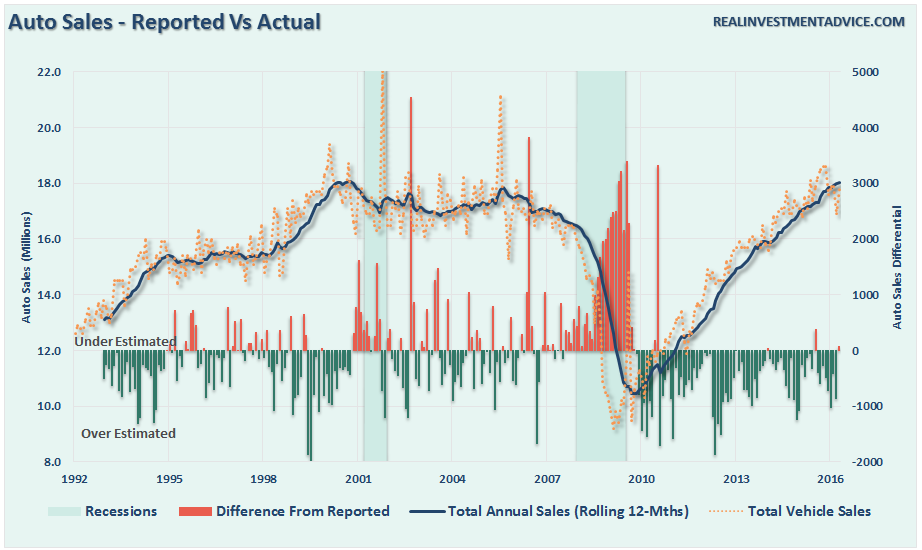
(Note: When auto sales are reported each month they are annualized. The bar chart shows the over/underestimation of auto sales each month as compared to what actually occurred on an annual basis.)
Here’s the problem. There is a finite number of people to sell new cars too.
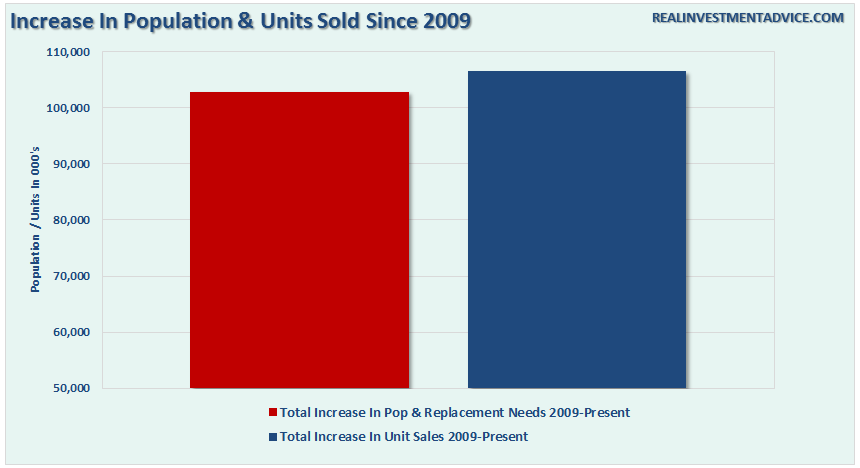
What the chart above shows is the number of cars sold currently now exceeds both the total increase in population and replacement needs of the existing population. In other words, the pool of available buyers is rapidly being depleted.
“But Lance, people will trade in those cars every couple of years, so the trend can keep going.”
Not really. As recently noted by Wolf Richter:
Deep-subprime borrowers are high-risk. Typically they have credit scores below 550. To make it worth everyone’s while, they get stuffed into loans often with interest rates above 20%. To make payments even remotely possible at these rates, terms are often stretched to 84 months. Borrowers are typically upside down in their vehicle: the negative equity of their trade-in, along with title, taxes, and license fees, and a hefty dealer profit are rolled into the loan. When the lender repossesses the vehicle, losses add up in a hurry.
Auto loans, in general, have been in a huge boom that reached $1.04 trillion in the fourth quarter 2015:
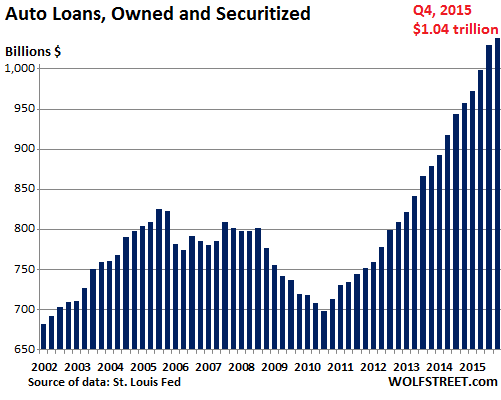
With more sub-prime auto loans outstanding currently than prior to the financial crisis, defaults rising rapidly and a large majority with negative equity in their vehicles, swapping out to a new car is becoming a near impossible option.
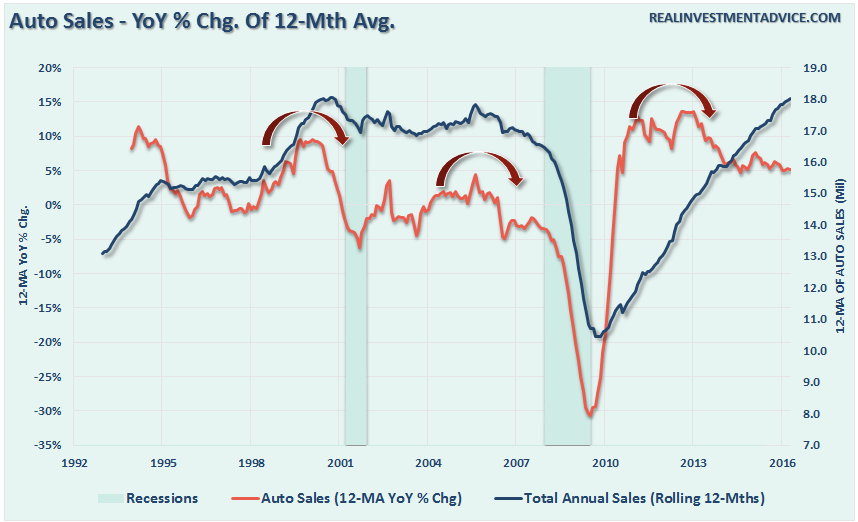
Given the importance of automobiles to the domestic manufacturing sector of the economy, the extent to which the sale of autos to consumers has likely reached an important inflection point. As shown in the last chart below, the previous recessionary warnings from autos was dismissed until far too late, it is likely not a good idea to dismiss it this time.
Mind The Gap
My friend and contributing editor, Michael Lebowitz of 720 Global Research, sent me a most interesting note on valuations and earnings yesterday.
Since October 1, 2011, the S&P 500 has risen 82% on the heels of strong earnings growth.
Let’s start over. Since October 1, 2011, the S&P 500 has risen 82% on the heels of a 0.75% decline in earnings. The price to earnings ratio over that time period has risen 83%, with price gains contributing 99% to the increase. Prices have risen substantially, while earnings have actually fallen. The chart below highlights the growing gap between earnings and the S&P 500.
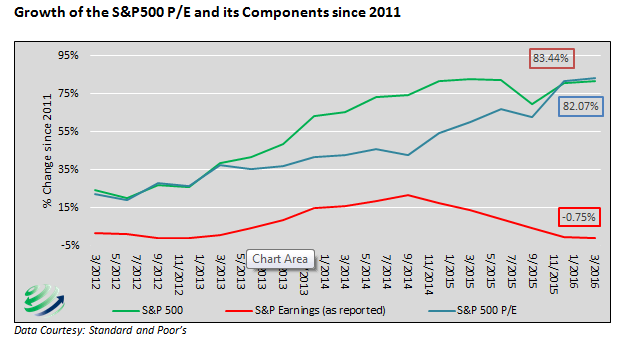
This chart illustrates that sentiment and momentum, and not fundamental rationale are the factors driving equity markets higher. To justify even a neutral position in equities we would need to see signs of stronger economic growth and revived corporate earnings growth. Unfortunately, the current outlook does not support either of those prerequisites.
With the information provided above as a backdrop, the following table from Goldman Sachs (NYSE:GS) offers further context on current U.S. equity valuations.
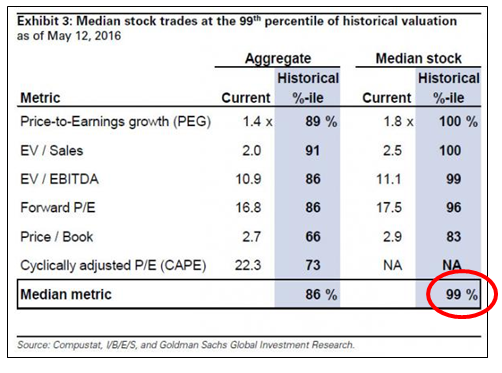
We are sympathetic to the idea that there are few alternatives for investors in desperate search of returns, but the risk-reward imbalance in the U.S. equity markets is severe. Stay long patience!
Markets Remain Detached
Michael is correct. Not only are stocks overvalued by virtually any measure, which denotes much lower rates of future returns from equities, but the economic deterioration also suggests a higher level of concern.
But for now, investors don’t seem to care as asset prices remain within reach of all-time highs.
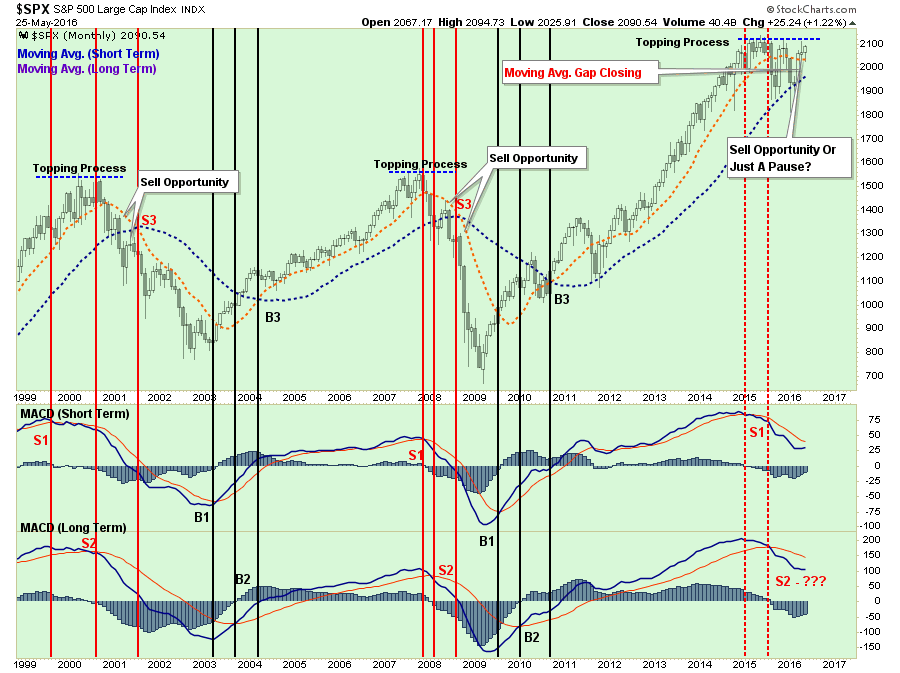
Of course, the reason investors continue to chase financial markets is the ongoing “quest for yield” due to record low interest rates on CD’s and money market funds.
This “yield chase” was specifically targeted by the Federal Reserve following the “financial crisis” as the need to buoy asset prices to restore consumer confidence was needed. By pushing interest rates to the zero lower bound, it gave consumers little choice but to push savings into the financial markets to obtain a higher return.
But, as with auto sales noted above, everything has a finite limit and the “chase for yield” by investors has become extremely unbalanced. Jesse Felder noted the same this past week when he wrote:
Let me get this straight: The professor [Jeremy Siegel] claims that investors are only just beginning to realize that bonds and cash have no yield thus there is no alternative to putting their money into dividend-paying stocks? In other words, we are only in the “first inning” of TINA (there is no alternative – to stocks)?
Can someone please do me a favor and show Prof. Siegel the charts below? Because it seems to me investors have been reaching for yield for several years now as a direct response to 7 years of ZIRP (zero interest rate policy).
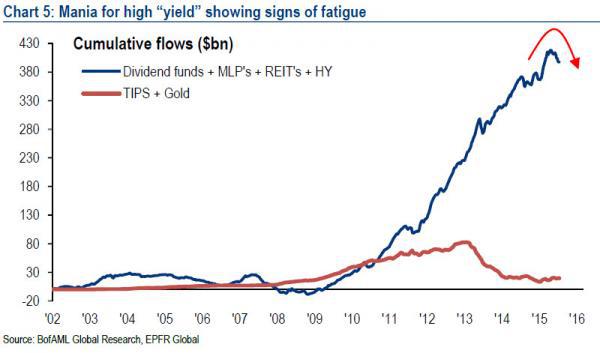
So my question for Prof. Siegel is this: If investors have already shifted entirely out of bonds and money market funds, where the hell is this new, massive shift into stocks going to come from? Perchance, you’re just feeling a bit too bullish once again?
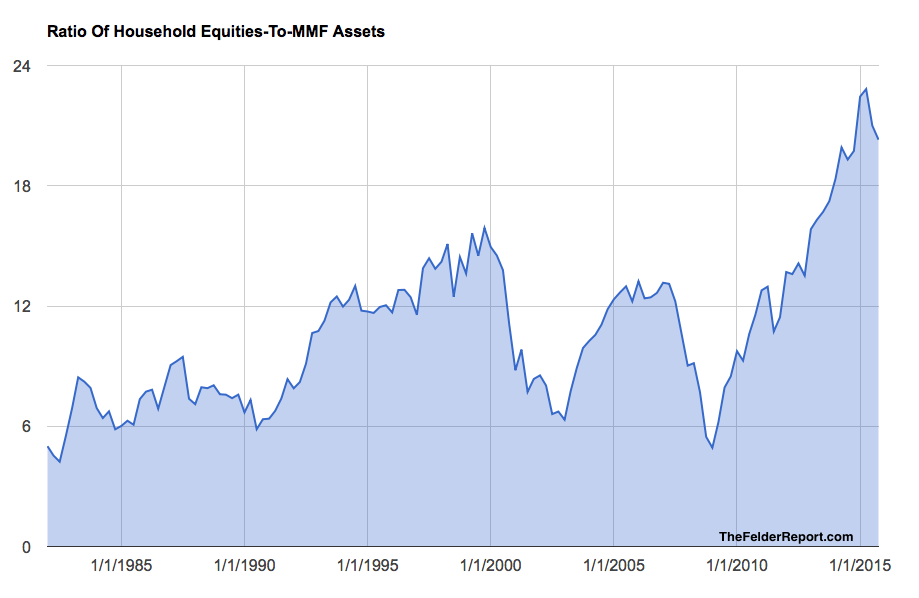
On a final note, this large-scale embracing of TINA could very well be the greatest sign of confidence in the stock market we have ever seen. And isn’t that precisely the psychological definition of a mania?
Yes, the “bull market” is currently alive and well.
However, there are mounting signs that a “cancer” has taken hold and will eventually reveal itself in the not so distant future. Unfortunately, for most investors, the inevitable outcome of chasing yield with a complete disregard of the underlying risk will be catastrophic.
But, while it is true that following the inevitable reversion asset prices will eventually recover, it is the “time lost” in reaching your retirement goals that is never regained.
Time is finite.
