A High-Yield Warning
With Janet Yellen recently warning about overvaluation in the bond market, I thought it would be important to look at potentially one of the single most overvalued areas in that market - high yield. To wit:
"However, the staff report noted valuation pressures in some asset markets. Such pressures were most notable in corporate debt markets, despite some easing in recent months. In addition, valuation pressures appear to be building in the CRE sector, as indicated by rising prices and the easing in lending standards on CRE loans. Finally, the increased role of bond and loan mutual funds, in conjunction with other factors, may have increased the risk that liquidity pressures could emerge in related markets if investor appetite for such assets wanes. The effects on the largest banking firms of the sharp decline in oil prices and developments in foreign exchange markets appeared limited, although other institutions with more concentrated exposures could face strains if oil prices remain at current levels for a prolonged period."
There is a significant chunk of high-yield debt that is associated with the oil and gas drilling sector that was used to chase "fracking" opportunities in Texas, Oklahoma and North Dakota. The one-two punch will come from a sustained period of low oil prices and a potential rise in borrowing costs for the sector. As I have discussed previously.
"But with valuations in the energy space exploding due to falling revenue and profitability, there is likely a good bit of "shaking out" left before this reversion is complete. (Also be careful of highly indebted oil related investments, there will likely be more liquidations than acquisitions in the not so distant future.)"
There is little doubt that a "bubble" has formed within the high-yield sector due to the incessant "chase for yield" given the Fed's ongoing drive to push interest rates toward the zero-bound. This has led investors to take on substantially more "risk" than they most likely realize which will result in substantial loss of principal during a mean-reverting event.
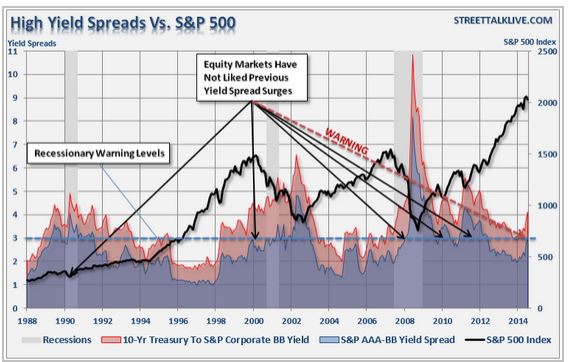
The chart below shows the spread between high-yield (junk bonds) and both AAA corporate bonds and 10-Year treasury bonds. When the spread between corporate AAA bonds and BB yields has historically gapped above 3%, the markets have historically experienced a fairly sharp contraction as "risk" was repriced. Currently, that spread is sitting at 3.04% as of the end of January.
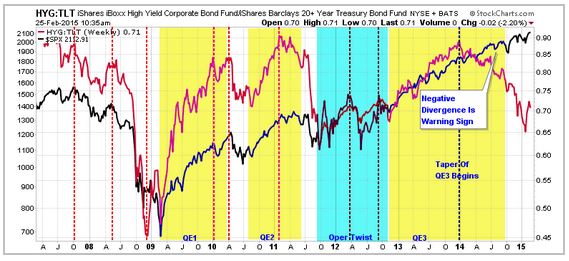
The next chart shows the impact of the Federal Reserve's liquidity push as it relates to "risk taking" by investors. Notice the high yield (junk bonds) rose sharply in price while the Federal Reserve was injecting the financial system with liquidity. However, when the Federal Reserve began "tapering" QE3, the price of high yield bonds declined pushing rates higher.
In other words, "risk" is coming out of the market as money seeks "safety" which has pushed Treasury bond yields below 2%. (Note: the last two times T-bond yields fell below 2% was during the debt ceiling debate/government default threat in 2011 and the Eurozone crisis in 2012. In both cases the market experienced a rather sharp correction.)
While the markets currently await the arrival of the ECB's version of QE, the warning being thrown off by high yield bonds warrants some attention.
Just One Chart For Janet Yellen
This past week, Janet Yellen gave her semi-annual Humphrey-Hawkins testimony before Congress. During her testimony, she made some very interesting statements overall but one really jumped out the most - "the economy is looking stronger."
I will agree that if you look only at the headline statistics of the unemployment rate or GDP it is certainly apparent that she is correct. However, in order for there to be a real recovery in the economy, which leads to higher demand, production, and consumption, there has to be employment gains beyond population growth in the 16-54-aged bracket.
The reason that I look at this group is that not only are they responsible for household formation and higher levels of consumption; but primarily because it strips out the argument of "retiring baby boomers." (Note: In truth, baby boomers aren't retiring either as those 55 and older that are employed is at their highest levels on record.)
Considering that the employment-to-population ratio of this age group is lower today than it was at the end of the financial crisis suggests that improvements in the labor market are not as robust as they appear.
The problem for Janet is that the monetary policy tool of lifting interest rates is a tool used to slow the rate of economic growth. With employment and wage growth weak, an economy that continues to churn along barely above 2% and an extremely overvalued range of assets; there may be much less room for the Fed to hike rates than currently believed.
Economy Not As Strong As Yellen Thinks
Continuing with Yellen's commentary about a "strengthening economic recovery," this is one thing that has yet to happen since the end of the financial crisis. As I discussed at length yesterday:
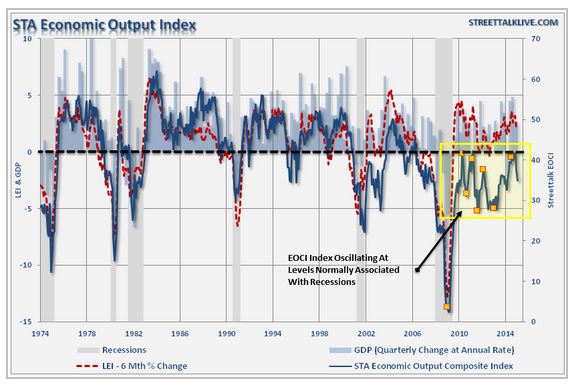
"Furthermore, a look at the extended history of the economic composite index, and comparing it to both GDP and the Leading Economic Index for validation, paints a very interesting picture.(The gold dots represent the start and end of QE1, QE2, LTRO, and QE3) Since the financial crisis ended, the economic composite index has remained confined to levels that have historically been associated with recessions in the U.S. economy. This goes a long way to explaining the weak wage and economic growth that has persisted since 2009."
The reason I bring this up, again, is because it clearly shows the "recovery/slowdown" cycle that has been reflective of the "range bound" economy over the last 5-years.
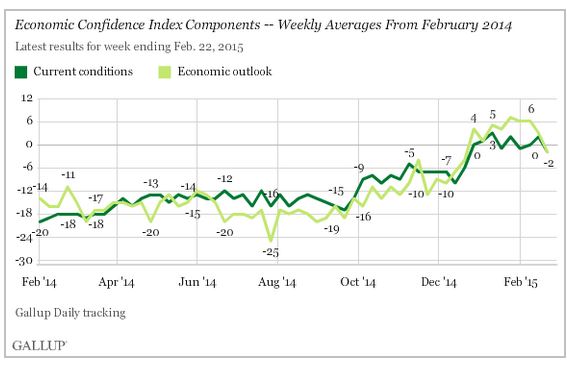
It also confirms the latest economic confidence poll from Gallup that showed confidence fell to an average of -2 for the week ending February 22nd. To wit:
"Gallup's U.S. Economic Confidence Index fell to an average of -2 for the week ending Feb. 22. This is the first time the index has had a negative weekly average since late December. Prior to that, the index had consistently been in negative territory since Gallup began tracking it daily in 2008.
The Economic Confidence Index fell five points from the week prior, the largest drop since July. The weekly index numbers are usually fairly stable, not changing more than a couple of points unless there is some significant event."
The most interesting aspect is that while the economy is showing some signs of impact from falling oil prices, a port strike in California, weak global demand for exports and an exceptionally cold winter; the markets are pushing all-time highs. There is much hope being placed on the ECB's plans for launching QE in March, however, much remains to be seen as to just how effective it will be in a negative interest rate/deflationary enviroment. But then again...there is always "hope."


