Gold prices peaked at $1,900 per ounce in September 2011. It was the end of a spectacular, decade-long bull market, during which the precious metal’s value increased a phenomenal 645 percent.
Since then, gold has struggled to regain momentum as an ever-climbing stock market has drawn more and more affection from investors. But after posting three straight years of losses, it looks ready to shake off this trend.
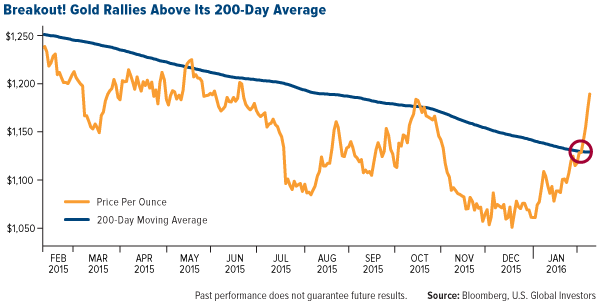
Not only is the metal trading at seven-month highs, it’s also on course for its longest winning streak since the glory days of 2011. What’s more, it’s broken clean through its 200-day moving average, a key indicator of growth.

In a recent report, HSBC suggests that we could be in the early stages of a new gold bull market, one that will “probably” usher the yellow metal back up to at least $1,500. This “forthcoming market,” says the bank, “has the potential eventually to exceed the speculative frenzy seen in 2011.”
Bold claims indeed, but there are signs that this gold rally is “stickier” than previous ones.
Stocks Are Making Investors Nervous
Historically, gold has had a very low correlation with stocks, meaning that in times of equity pullbacks, the metal has tended to hold its value well.
We’re seeing this unfold right now. While S&P 500 Index stocks have slumped nearly 10 percent so far this year, gold is shining bright at 12.7 percent. Even normally reliable tech stocks, including Netflix (O:NFLX), Facebook (O:FB) and Amazon (O:AMZN), have disappointed in 2016 so far.
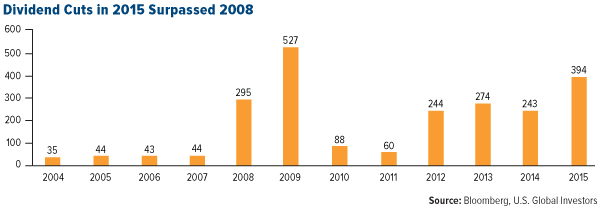
In addition, the number of companies trimming or altogether suspending dividends surpassed 2008 levels last year, according to Bloomberg. Nearly 100 more dividends were cut in 2015 than in 2008, suggesting further trouble could be brewing. Goldman Sachs reports that in the last three months alone, at least 20 oil companies have adjusted payouts down as crude prices continue to drag.

The same pain is being felt in China, one of the two largest gold markets, alongside India. With the Shanghai Composite Index having lost 46 percent since June 2015, many investors are rotating back into gold.
Global Demand Is Scorching Hot
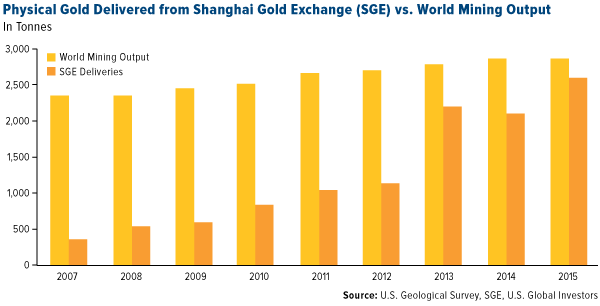
Speaking of China and gold, 2015 was a red-letter year for demand. Physical delivery from the Shanghai Gold Exchange reached a record 2,596 tonnes, representing more than 90 percent of total global output for the entire year.

The country’s central bank also continues to buy gold at an impressive pace. Kitco News reports that the People’s Bank of China added 16.44 tonnes, or 580,000 ounces, to its official reserves in January as it seeks to support its currency, the renminbi.
In 2015, and so far in 2016, sales of gold coins in both the U.S. and Europe have been nothing short of breathtaking. Sales of American Eagle gold bullion coins reached 124,000 ounces in January, up 53 percent from a year ago. And last year at the Austrian Mint, one of Europe’s largest, consumers bought up 1.75 million coins, four times the volume sold in 2008 before the financial crisis.
I always say to follow the money, and right now American money managers and hedge funds are increasing their bets that gold prices will continue to climb. According to data from the Commodity Futures Trading Commission (CFTC), as of February 2, net long positions on the metal are at a three-month high of 100,566 after rising by 4,821 contracts in only a week’s time. Short bets, on the other hand, declined by 7,412 contracts during the same period.
Negative Interest Rates in the U.S.?
In December, the Federal Reserve bumped up interest rates 0.25 percent, the first time it had done so in nearly a decade. But that doesn’t mean it can’t reverse course, and there’s growing speculation that rates could be dropped below zero into negative territory.
We’ve already seen this occur elsewhere, most notably in Sweden, Switzerland, Denmark and Japan. More than a fifth of global GDP—23.1 percent, to be precise—is now produced in countries governed by a central bank with negative interest rates, according to the Wall Street Journal. In a world where you’re charged interest to put your cash into government bonds, holding gold as a store of value suddenly becomes much more attractive.
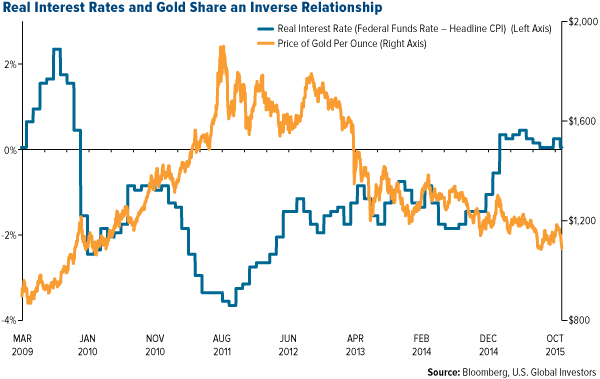
I’ve discussed many times in the past that the yellow metal shares an inverse relationship with real interest rates, which is what you get when you subtract inflation from the federal funds rate.

Negative nominal rates in the U.S. might seem like a far-fetched idea, but the Fed has already hinted that banks should prepare for such monetary policy. (And JP Morgan suggests rates could fall to as low as negative 1.3 percent.) It would be prudent for investors to do the same.
U.S. Global Investors, Inc. is an investment adviser registered with the Securities and Exchange Commission ("SEC"). This does not mean that we are sponsored, recommended, or approved by the SEC, or that our abilities or qualifications in any respect have been passed upon by the SEC or any officer of the SEC.
This commentary should not be considered a solicitation or offering of any investment product.
Certain materials in this commentary may contain dated information. The information provided was current at the time of publication.
Holdings may change daily. Holdings are reported as of the most recent quarter-end. None of the securities mentioned in the article were held by any accounts managed by U.S. Global Investors as of 12/31/2015.
All opinions expressed and data provided are subject to change without notice. Some of these opinions may not be appropriate to every investor. By clicking the link(s) above, you will be directed to a third-party website(s). U.S. Global Investors does not endorse all information supplied by this/these website(s) and is not responsible for its/their content.
The S&P 500 Stock Index is a widely recognized capitalization-weighted index of 500 common stock prices in U.S. companies. The Shanghai Composite Index (SSE (L:SSE)) is an index of all stocks that trade on the Shanghai Stock Exchange.
There is no guarantee that the issuers of any securities will declare dividends in the future or that, if declared, will remain at current levels or increase over time.
