Russia’s “beef” with Ukraine is leading to a variety of near-term repercussions. The turmoil is producing interest in traditional safer-haven assets like the Japanese yen, U.S. Treasuries, as well as gold. It should be noted, however, that these perceived safer holdings have been gaining in price since the year began. Russia’s recent military maneuvering has merely intensified a desire for protection.
Yet not all investments that currently show relative strength fit as neatly into the “risk-off” category. There are a number of commodity, utility and “military might” plays that have been gaining traction as well. Here, then, are three lesser-known ETFs with the potential to gain on the Ukraine conflict:
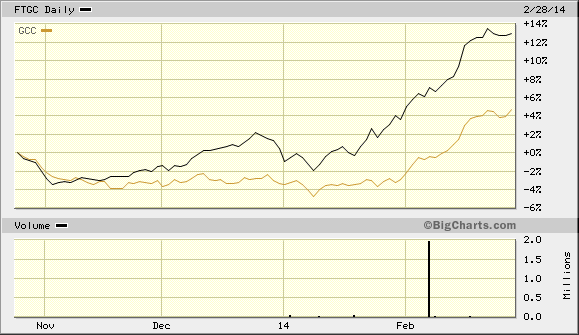
1. First Trust Global Tactical Commodity Strategy (FTGC). This actively managed exchange-trader does not invest directly in commodities; rather, it seeks an “attractive” risk adjusted total return through the use of commodities futures contracts and commodity-linked notes. Through active management as well as diversification, the portfolio management team looks to reduce overall volatility. Not surprisingly, the active management does not come cheap at a gross expense ratio of 0.95%. Nevertheless, the recent momentum is difficult to ignore. First Trust's recently introduced commodity vehicle has handily outpaced diversified gems like Greenhaven Continuous Commodity (GCC).
What makes FTGC particularly intriguing is the idea that it does not necessarily need to be fully invested at all times. An index-tracker like GCC does. In other words, the active managers of FTGC may opt to stay out of energy or industrial metals if they believe there is a reason to reduce risk. Or they might overweight precious metals. Meanwhile, the managers could overweight agriculture due to Ukraine’s leading position as a grains producer and due to drought conditions around the world.
Personally, my clients maintain a limited exposure to commodities. Moreover, FTGC is not on my “buy list.” I prefer passively managed index ETFs to the expensive counterparts. Still, the asset class maintains a very low correlation to stocks or bonds. To the extent one believes that commodity selection can improve performance in the space, FTGC could be a worthy addition for portfolio diversification.
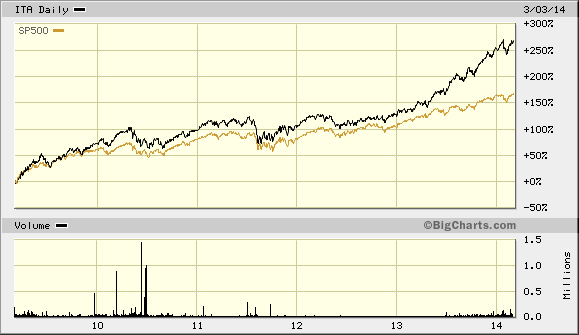
2. SPDR Aerospace and Defense (XAR). General Dynamics Corporation, (GD), Lockheed Martin Corporation, (LMT), Raytheon Company, (RTN). It should not come as a big surprise that defense contractors tend to thrive when geopolitical tensions rise around the world. What might come as a surprise is just how strong the sector has been throughout the 5-year bull market. The better-known iShares U.S. Aerospace & Defense (ITA) has managed to make the S&P 500 ’s performance look pedestrian.

Granted, a money manager like myself cannot necessarily use a fund with limited liquidity such as the lesser-known XAR. Yet retail investors might be intrigued to learn that XAR has outperformed ITA over 1 month, 3 months, 6 months and 1 year. Moreover, XAR’s expense ratio is reasonably attractive at just 0.35%.
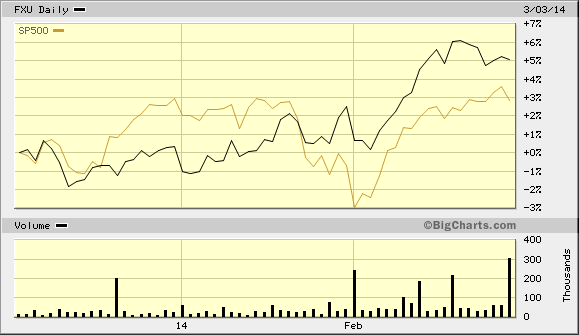
3. First Trust Utilities AlphaDEX Fund (FXU). One of the clear-cut trends of 2014 has been lower, not higher, interest rates. The conflict in Ukraine has clearly created even greater demand for U.S. Treasuries, as the 10-year yield is now 40 basis points lower than it was at the start of 2014. When the 10-year moves from 3.01% to 2.61% — when the 10-year might drop even more — the spread between utility dividends widens. More specifically, they widen until equity investors take a bit more risk by scooping up high yielding utility stocks.
What makes FXU unique is the tracking of the AlphaDEX index — an index of companies with verifiable revenue growth, return on assets and price-to-book (P/B). The collective price-to-sales for FXU is 1.2 and the P/B is 1.4. Over a 1-year period and a 5-year period, FXU has outperformed its big brother, SPDR Select Sector Utilities (XLU).
Disclosure: Gary Gordon, MS, CFP is the president of Pacific Park Financial, Inc., a Registered Investment Adviser with the SEC. Gary Gordon, Pacific Park Financial, Inc, and/or its clients may hold positions in the ETFs, mutual funds, and/or any investment asset mentioned above. The commentary does not constitute individualized investment advice. The opinions offered herein are not personalized recommendations to buy, sell or hold securities. At times, issuers of exchange-traded products compensate Pacific Park Financial, Inc. or its subsidiaries for advertising at the ETF Expert web site. ETF Expert content is created independently of any advertising relationships.


