After combing through a year’s worth of charts on emerging markets, we think these are the top three you should pay attention to.
You know the old saying, “A picture is worth a thousand words.” Well that saying certainly holds true for understanding investment opportunities. So we’ve chosen three charts that explain why investors need to give emerging markets a fresh look.
1. Emerging markets forecasted to outpace developed markets

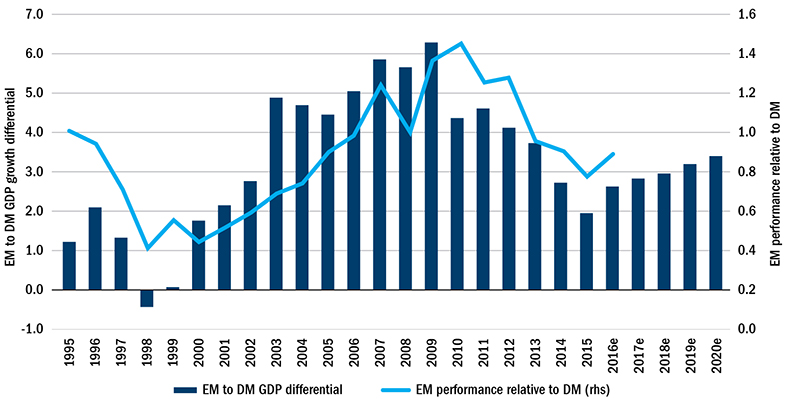
Actual and projected emerging market (EM) GDP growth vs. domestic market. (DM) growth 1995-2010. Source: International Monetary Fund World Economic Outlook as of October 2016, Bloomberg as of September 2016.
Rising GDP differential signals better emerging market performance
The International Monetary Fund forecasts that emerging markets gross domestic product (GDP) will grow 4.2% in 2016 vs. 1.6% for developed markets — a 2.6% growth differential. This is the first expected growth differential since 2011, with projections to increase every year through 2020. Historically, when emerging market GDP growth accelerates quicker than developed market GDP growth (the EM to DM growth differential increases), emerging market equities have usually outperformed.
2. Emerging market exports by region

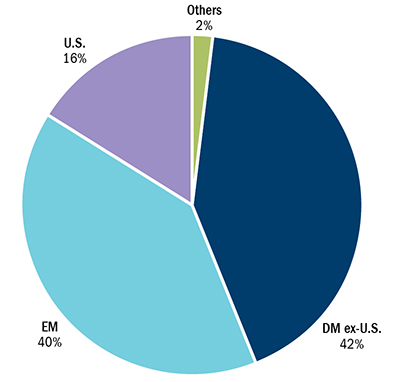
Source: International Monetary Fund (Direction of Trade Statistics), Columbia Management Investment Advisers, LLC as of December 31, 2015.
Emerging markets aren’t reliant on exports to U.S.
Donald Trump as incoming president of the United States has raised questions about the impact of forthcoming trade policies. Because Trump has opposed the proposed Trans-Pacific Partnership deal, called for fundamental changes to the NAFTA pact with Mexico and Canada, and threatened to impose punitive 45% tariffs on goods from China, there is concern that emerging markets could be the targets of these policies.
However, even if the U.S. implements more of a protectionist stance on trade, it does not necessarily spell doom for emerging markets. As the size of the emerging market economies has grown — now 40% of global GDP, doubling over the past 25 years — so has the contour of emerging market trade. Their exports to the U.S. have become a smaller slice of the pie, totaling only 16%, down from 21% in 2005. And exports to developed markets excluding the U.S. are also down, totaling 42% of exports versus 49% in 2005.
At the same time, exports of emerging market countries to other emerging market countries has increased to 40% of total exports, up from 28% in 2005. It is important to remember that trade is a two-way street. A full 46% of U.S. exports are to emerging markets (up from 36% in 2005), suggesting the U.S. may be more vulnerable to any trade confrontation with the emerging markets.
3. India leading the competition

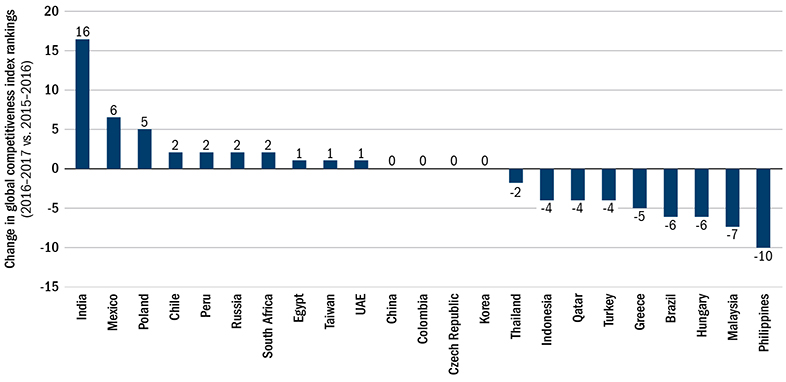
Source: World Economic Forum, Columbia Management Investment Advisers, LLC. As of 09/28/16.
India’s competitiveness ranking registers the largest gain by any country. India jumped 16 places to rank 39 on the World Economic Forum’s Global Competitiveness Index 2016–2017. This follows a similar gain from last year where India jumped from to 71 to 55.
Thanks to improved monetary and fiscal policies, as well as lower oil prices, the Indian economy has stabilized and now boasts the highest growth among the G-20 countries and the largest gain in competitive ranking by any country. Recent reform efforts have concentrated on improving public institutions, opening the economy to foreign investors and international trade, and increasing transparency in the financial system.
