I may expect a few bad trading days. I may even believe that we are likely to see a modest pullback of 3%-4% in U.S. equities before Santa reinvigorates the rally. Nevertheless, a variety of indicators are foreshadowing danger – the same coal mine canaries that preceded the September-October sell-off.
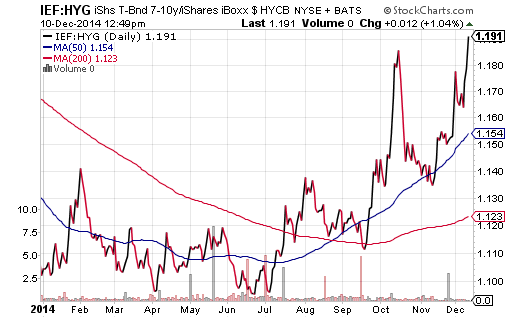
For example, high yield corporate bonds (a.k.a. “junk”) are being cremated again. Take a look at the iShares 7-10 Year Treasury (ARCA:IEF):iShares High Yield Corporate (ARCA:HYG) price ratio in the chart below. If you thought that widening credit spreads were a bad sign a few months earlier, then you should be equally concerned about the issue today.

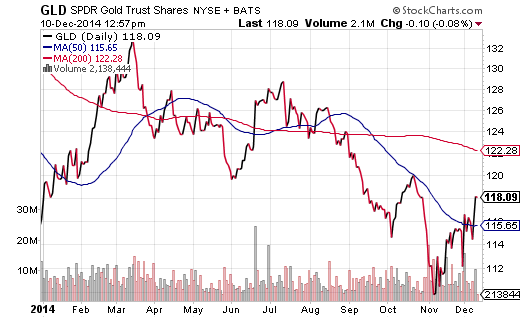
Now get a gander at one of the world’s most talked about precious metals: Gold. US Dollar bulls and commodity bears alike had declared gold dead this past November. Many stated that once gold had dropped from $1200 per ounce to the $1150 level, it was only a matter of weeks before we would see $1000 per ounce.
It is not that exchange-traded vehicles like SPDR Gold Trust SPDR Gold Trust (ARCA:GLD) are proving their mettle as a hedge against global currency devaluation. On the flip side, spot gold is back above $1200 per ounce and GLD is well above a 50-day trendline. Both tend to suggest that near-term fear about stock assets is present.
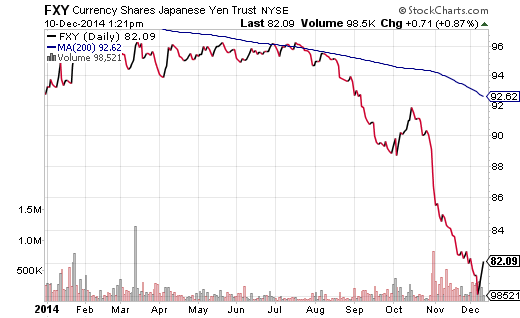
Finally, since the Bank of Japan’s announcement that it would substantially increase its asset purchases with electronically printed yen (a.k.a. “quantitative easing”), proxies like Currency Shares Yen Trust (ARCA:FXY) have existed in a perpetual state of free-fall. Until now. The possibility that carry traders may need to sell the dollar and dollar-denominated stock assets to pay back their yen loans is an ever-present possibility. In other words, an unwinding of the yen carry trade is something to watch out for.
The yen via FXY rapidly appreciated for the initial two weeks of October. Then the world’s central banks, primarily the Fed, discussed their flexibility with respect to keeping overnight lending rates near 0% for a much longer period than the markets had been pricing in. Thus, the yen resumed its slide. Today, however, investors may wish to pay attention to any spike or any potential for a sustainable uptrend in the yen via FXY.
It should be noted that gold, longer-term treasuries as well as the yen are components of the FTSE Custom Multi-Asset Stock Hedge Index (a.k.a. “FTSE Custom MASH Index.”). For many, an allocation to U.S. sovereign debt as well as gold makes sense in hedging against stock risk. On the other hand, why would the yen be included in “multi-asset stock hedging” when the dollar tends to benefit from a flight to safety? For one thing, the yen benefits from the unwinding of the carry trade in worldwide finance. Secondly, the yen still has cache as a “safer” currency based on Japan’s standing as one of the world’s largest economies. Moreover, the yen gained ground in 2008 and in 2011.


