The media spread US Census' good news:
Median household income in the United States was $56,516 in 2015, an increase in real terms of 5.2 percent from the 2014 median of $53,718. This is the first annual increase in median household income since 2007, the year before the most recent recession.
5.2% is a big number which does not gel with other economic realities.
Follow up:
Most ignored the second line in the sentence in the US Census summary:
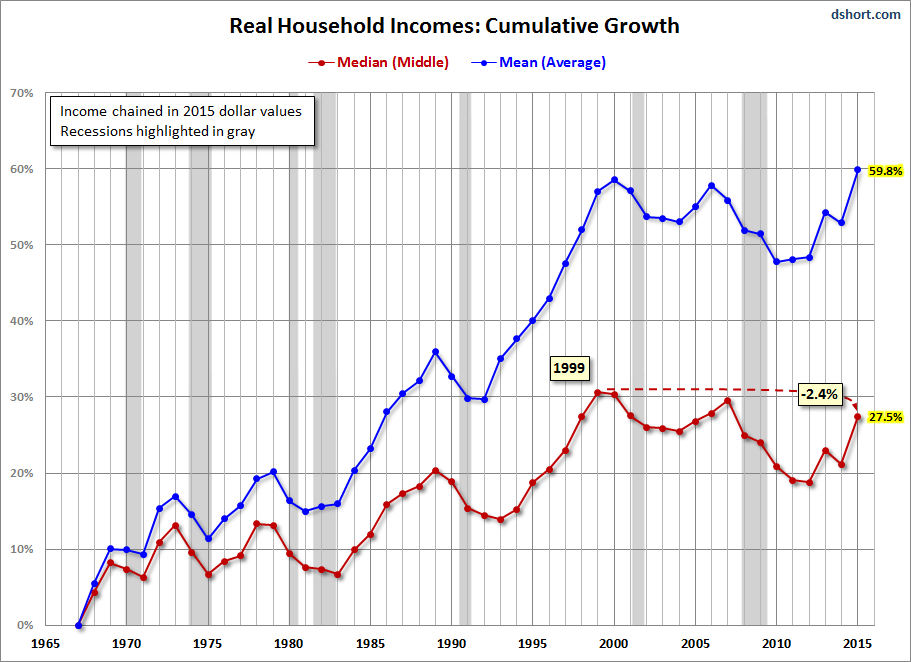
In 2015, real median household income was 1.6 percent lower than in 2007, the year before the most recent recession, and 2.4 percent lower than the median household income peak that occurred in 1999. (The difference between the 2007 to 2015 and 1999 to 2015 percentage changes was not statistically significant.)
The 5.2% is not the take home number (disposable income).
The 5.2% gain does not include the affects of personal taxes - as most of us think of income as the value of our paycheck, not the surprise number that is shown on your W-2. Incidentally, taxes increased 8.5% in 2015 (BEA Table 2.1. Personal Income and Its Disposition) - and taxes averaged 12.5% of personal income in 2015 and 12.1% in 2014.
Most of use view income as disposable income - not the W-2 number.
As health insurance is now mandatory in the USA, I have never understood why health insurance costs are not part of the reduction process to determine disposable income. [I know the answer - no President wants his legacy to include a drop in disposable income.] It is not uncommon for health insurance to exceed 20% of household income - especially for lower income households.
Almost all the 5.2% income gain came from more workers per family.
From the report - the number of households increased from 124,578,000 to 125,819,000 or 0.1%. From the the BLS - the civilian employment level rose 1.7% in the same period. You should conclude that something around 1.6% gain in the 5.2% number was due to more people working. [Note that the subject US Census report says 1.1% more people per family are working]
Consider that the subject US Census report says 5.2% income gain for the family - but at the same time states the median earnings gain for full time workers was 2.9%. This is another indication the median family income gain came from additional members of households working.
This is good news, giving more breathing room to the lucky families for balancing family finances for some "median family households".
But the US Census report shows a growing income gap.
The jump in income is not all good - as the data is also showing a growing income gap. Note this chart from Doug Short incorporating the troubling aspect of the Census Bureau's latest annual household income data.

The difference between median and average income shows that the top quartiles of the population are enjoying larger gains.
I continue to believe the growing income gap is like a ticking time bomb which needs to be resolved.
Are we comparing apples to apples?
My initial reaction to the 5.2% number did not include any suspicion that the methodology could have changed. [Hat tip to Dan Flemming for bringing this to my attention].
A post from David Stockman (the same David Stockman who was the Director of the Office of Management and Budget (1981–1985) under President Ronald Reagan) stated in part:
Starting in 2013 with a partial phase-in, which was fully implemented in 2014 and 2015, Census changed the questions and the methods it uses in calculating the “money incomes” of households. During 2014, for example, it started to “collect the value of assets that generate income if the respondent is unsure of the income generated.”
It also helpfully filled in the questionnaire where respondents answered with “don’t know” or where they “refused” to answer with its own prompted quesstimates about what the answer should have been!
For instance, as a result of this “improved reporting” of interest income, the number of recipients in this category increased by 41.6%, according to John Williams at Shadow Statistics. And the aggregate amount of interest income collected soared by 111.7%
In this simple post, I cannot do justice to the issues raised by David Stockman but it deserves a read.
Inflation, inflation, inflation
It is becoming obvious that the inflation indexes compiled by the BLS and BEA (using some of the US Census data) are understating inflation (such as health care). This is causing inflation to run under Federal Reserve targets - and keeping the USA out of a recession by creating a very small adjustment to calculate real GDP (instead of a larger one which would show the economy in contraction).
The 5.2% US Census number was not adjusted for inflation. But even if the 5.2% was adjusted for inflation, the BEA calculated that personal consumption expenditure adjustment for inflation in 2015 was a mere 0.4%? This means the inflation adjustment to the 5.2% number would be minimal.
Political Motivations
Good data coming out just prior to election cycles should be immediately suspect. Manipulation and spin of data for political gain has been employed by both political parties. I view David Stockman's post the same way as he is a political animal.
Correct decisions are not based on manipulated data. If you tell a lie enough times, does the liar begin to believe the lie?
Does the Federal Reserve really believe the inflation numbers?
In Summary
The 5.2% median household income increase in 2015 is a spun number. I do believe that the median household is better off in 2015 than 2014 - just much less than 5.2% better off.
Other Economic News this Week:
The Econintersection Economic Index for September 2016 is showing better growth for the second month in a row - but the rate of growth outlook remains weak. The index remains near the lowest value since the end of the Great Recession. There remain recession warning flags in some of the data we are reviewing.
Bankruptcies this Week: ITT Educational Services, Privately-held Fansteel, Bank of Commerce Holdings (BOCH), 4Licensing (f/k/a 4Kids Entertainment)
Click here to view the scorecard table below with active hyperlinks
Weekly Economic Release Scorecard:

