Since bouncing off their recent April 11 lows, stocks are now working on their sixth consecutive day of gains.
To the casual observer without any knowledge of technical analysis, it may appear as though the the correction of the past few weeks is over and the major indices are once again working their way back to new highs.
But even though any scenario is indeed possible in the stock market, there are…
3 Reasons Why The Stock Market Correction Is Not Yet Finished:
- So far, the countertrend bounce off the lows has mostly been on declining volume. This points to a lack of demand among institutions, which are likely standing by to unload more shares into strength in the coming days.
- The stock market is being held up by energy, utilities, and real estate sectors, while growth-type stocks are in repair mode. When leading stocks and sectors in the market are considered “defensive,” I surely know it is not the type of momentum-driven bull market I am thrilled to buy.
- The NASDAQ is approaching a plethora of technical overhead resistance levels, such as its prior “swing high,” 50-day moving average, and downtrend line from the early March high. Although the benchmark S&P 500 Index is in much better shape because it remains closer to its all-time highs, relative weakness in the NASDAQ (which should take some time to work itself out) may continue to hold any rally attempts by the rest of the broad market in check.
Based on the valid, objective reasons above, I am viewing the current countertrend bounce in the stock market as an opportunity to sell short at low-risk entry points, as opposed to risking capital on the long side of the market (with the exception of select ETFs with minimal to zero correlation to stocks).
2 Stocks (Plus 1 “Short ETF”) To Put On Your Short Selling Watchlist
As mentioned above, there are still a handful of non “A-rated” stocks that may push higher in the near-term, but clearly this is not my type of high momentum, growth-driven market to swing trade on the long side.
Presently, there are a handful of stocks that meet my criteria for selling short (former leading stocks blowing up), but I have not yet spotted low-risk swing trade entry points on the daily charts.
My favorite type of short setup is when a recent leadership stock breaks down on the weekly chart, then begins to set “lower highs” and “lower lows” beneath its 10-week moving average (similar to the 50-day moving average).
Lululemon Athletica
A good example of this type of short selling setup can be found in Lululemon Athletica inc (NASDAQ:LULU), which convincingly formed a major top in 2012 and 2013, after previously ripping 3,000% off the lows of 2009. This is shown on the weekly chart below:
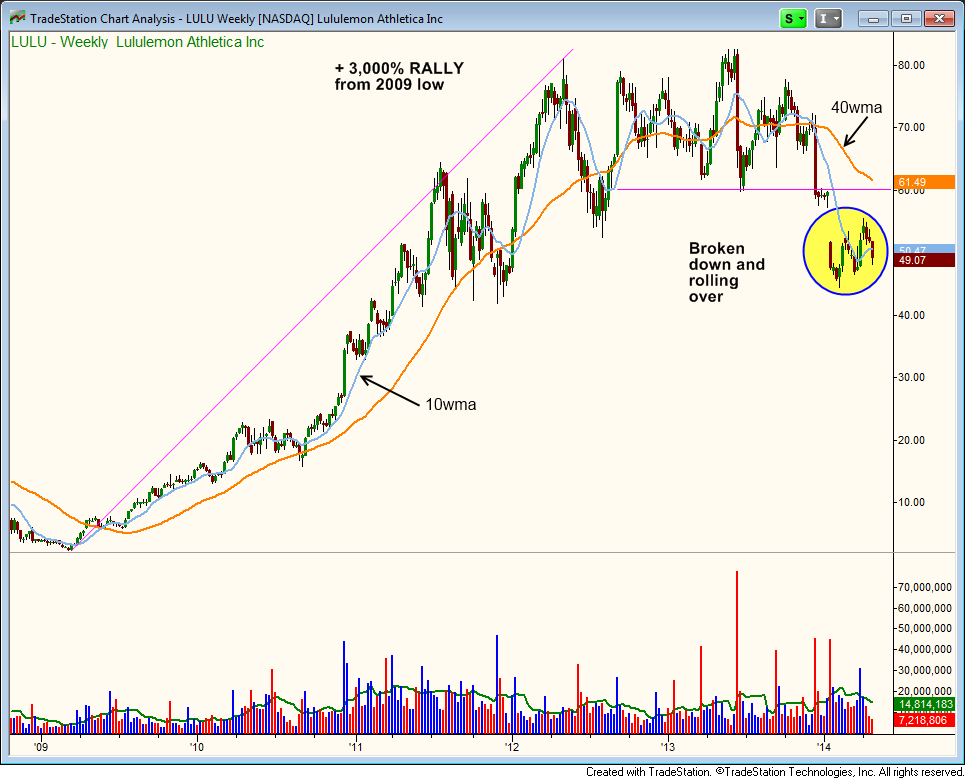
With LULU below the key horizontal price support of the $60 level, its 40-week moving average, and recently below the 10-week moving average as well, the stock could suffer a pretty ugly sell-off over the next several months if broad market conditions continue to deteriorate.
Zooming in to the shorter-term daily chart of LULU (below), notice the stock has recently touched the lower channel support of a short to intermediate-term rising channel:
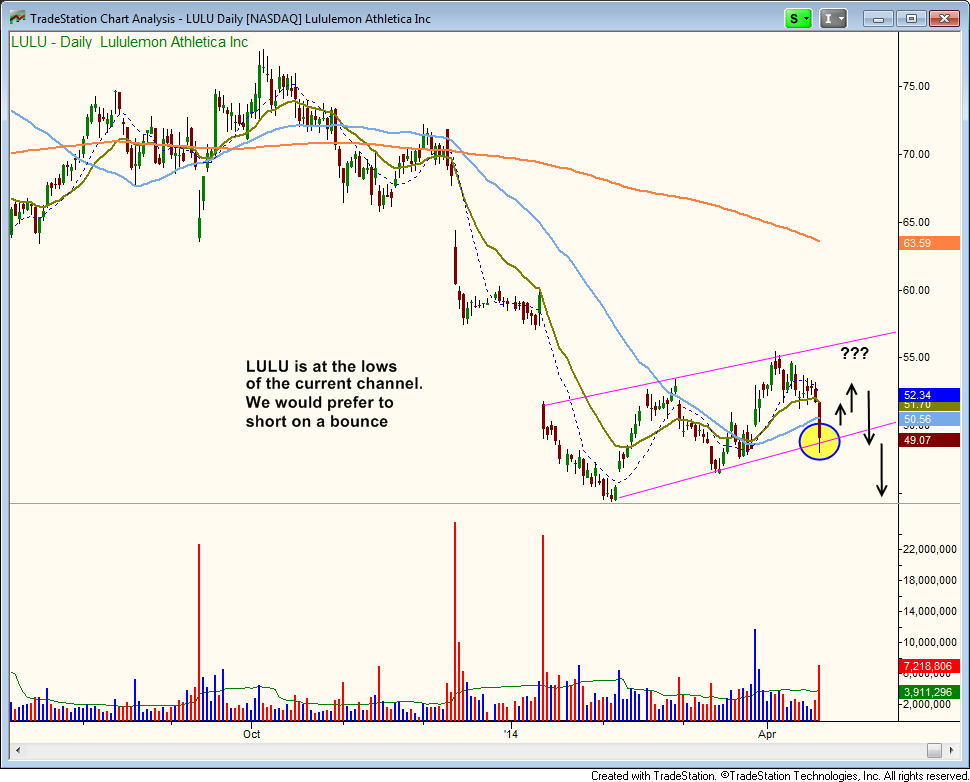
Since LULU has just come into support of its lower trend channel (circled in blue), the current price of LULU does not offer much of a low-risk entry point. Instead, I would ideally love to see LULU bounce to the $53-$54 area, then stall out again.
Such price action would form the first “lower high” on the daily chart interval. But until that happens, I am simply monitoring this stock on my internal short selling watchlist.
Conns
Another example of a former leadership stock that has blown up is Conns Inc (CONN.O), which rallied more than 2,000% off its 2011 lows before crashing through its 40-week moving average (similar to 200-day moving average) earlier this year:
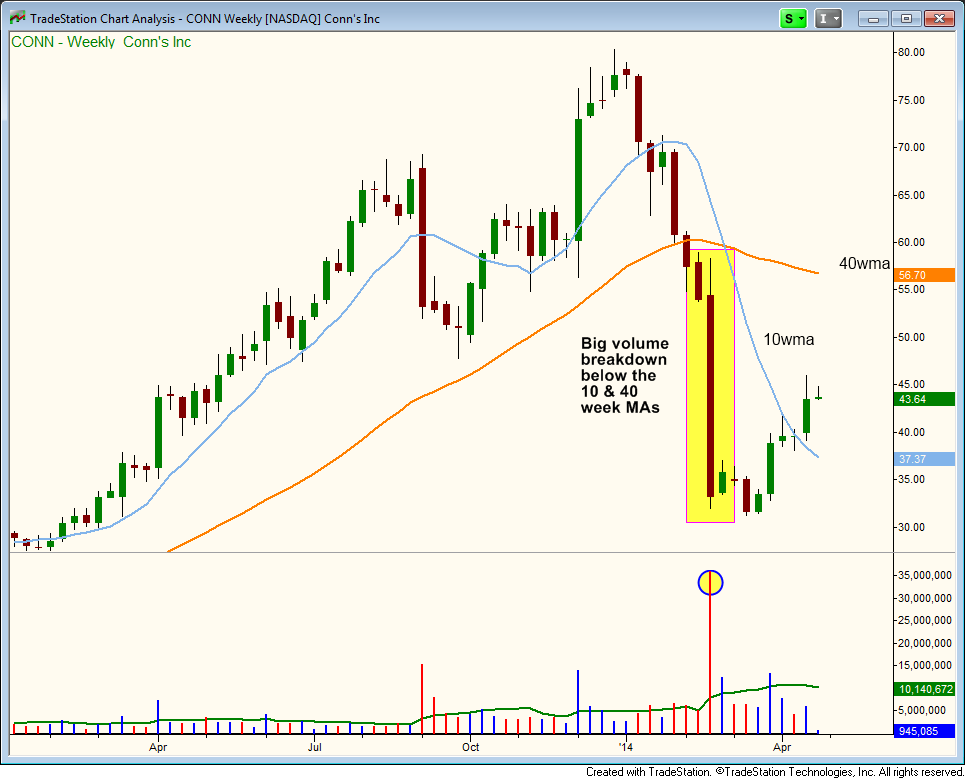
Since plunging through its 40-week/200-day moving average on huge volume (a sign of institutional distribution), it has been grinding higher over the past six weeks, and has recently closed back above its 10-week/50-day moving average.
Next, let’s drill down to the price action on the daily chart:
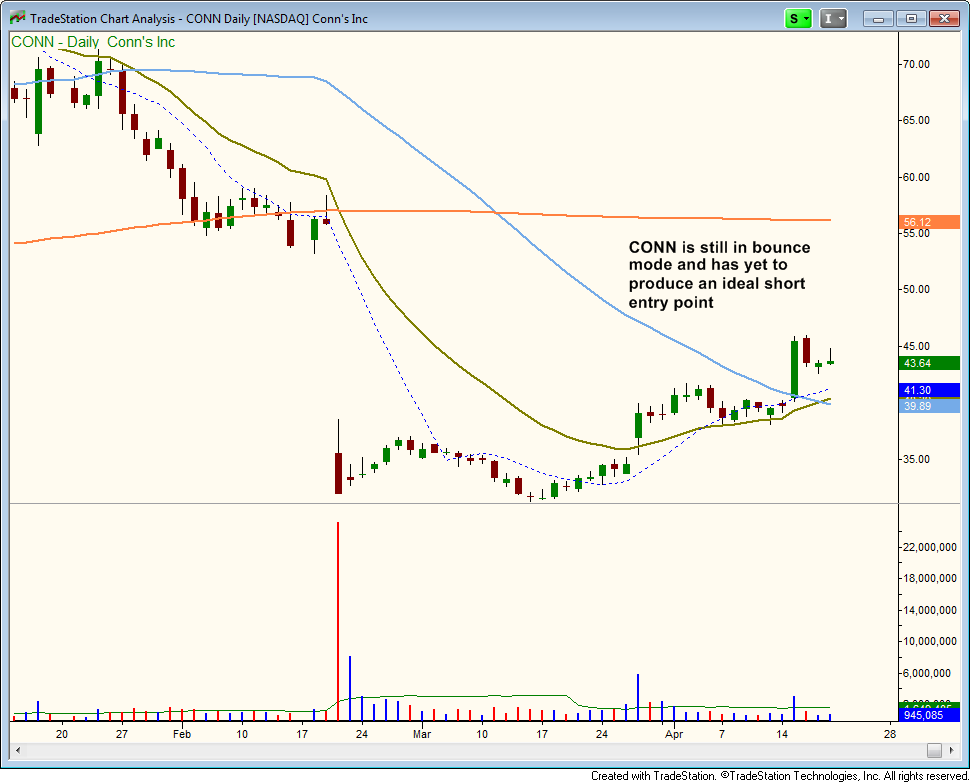
Although CONN is still in bounce mode, I do not think the stock will fill the gap created in February of this year. As such, a bounce to the $50 area would be a gift of an entry on the short side (if it can get there).
As with $LULU, I remain on the sidelines with this setup, but will be monitoring closely for a potential short entry.
Selling Short Financials With A “Short ETF”
Two weeks ago, the S&P Bank SPDR ETF (KBE) sliced through key, intermediate-term support of its 50-day moving average on heavy volume, and has since been wedging higher on lighter than average volume:
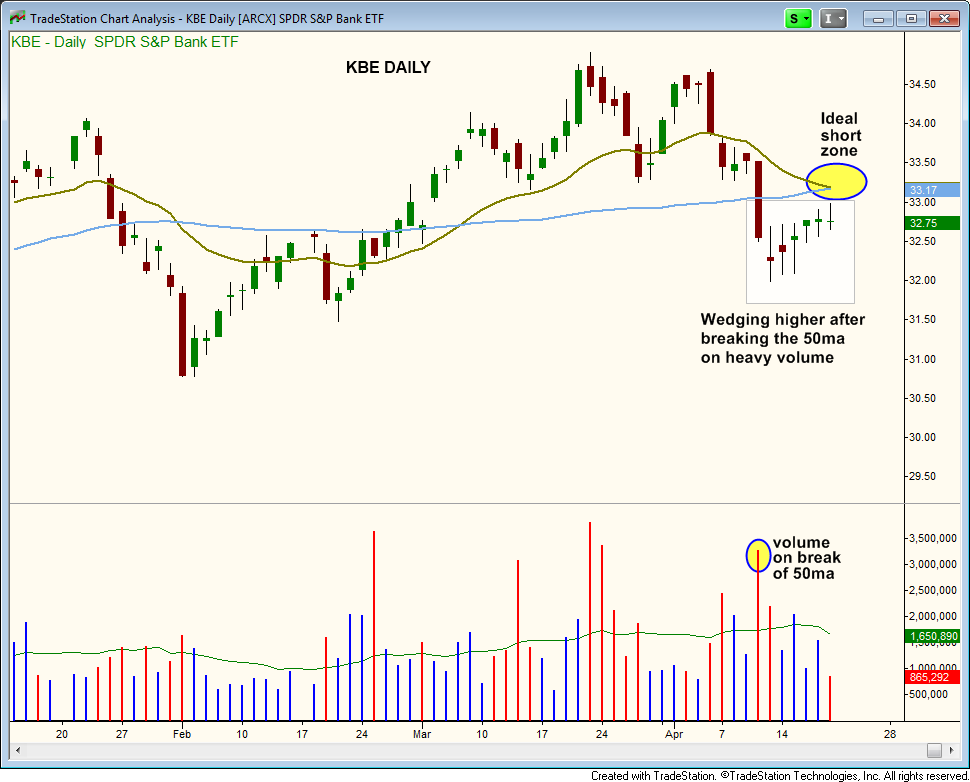
Labeled as “ideal short zone” on the chart above, notice how the 20-day exponential moving average and 50-day moving average have converged to form major overhead resistance. A bounce to (or near) that level of moving average convergence, followed by a bearish reversal candlestick or gap down, would provide me with a low-risk short selling entry point.
If an ideal short entry develops, I would look to sell short KBE by buying leveraged Financial Bear 3x ETF (ARCA:FAZ), which has plenty of liquidity with an average of more than 7 million shared traded per day:
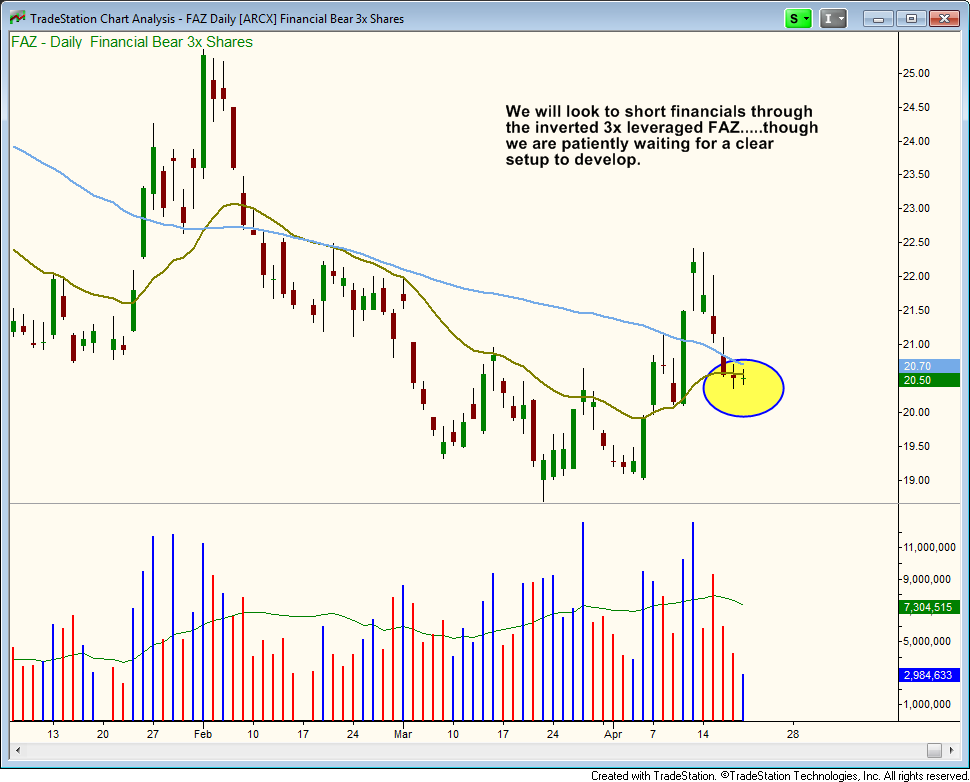
Although the price and volume action has not been that impressive during the bounce off the lows, the market could continue to push higher for a few more days before reversing.
Because of this, I feel it still may be a bit too early to get busy on the short side with KBE/FAZ.
As a side note, leveraged ETFs such as FAZ should not be held as long-term “investments” because they frequently underperform the underlying index with longer holding periods.
But for momentum swing trading, I find ETFs such as FAZ to be suitable trading vehicles. Further, “short ETFs” are a great way for traders & investors with non-marginable accounts (such as IRAs) to gain short exposure to the market.
Timing Is Everything – Especially On The Short Side!
Over the past 15 years, I have learned the market is much less forgiving of sloppy timing on the short side compared to long entries in a bull market. As such, patience to enter any of the three short setups above (and many others) is crucial right now.
Further, it’s important to understand that new long entries are not yet completely off the table. If, for example, the stock market pulls back after this rally, comes into support and holds, new long setups may emerge.
For now, it’s even fair to say stocks are merely entering into a protracted trading range.
Nevertheless, in the coming days and weeks, I will be providing subscribers of The Wagner Daily with my preset and exact entry, stop, and target prices for these and any other stocks/ETFs that meet my criteria for swing trade entry.
