Get 40% Off
⚠ Earnings Alert! Which stocks are poised to surge?
See the stocks on our ProPicks radar. These strategies gained 19.7% year-to-date.
Unlock full list

Facebook Churns Above $80

Published 04/08/2015, 02:45 AM
Updated 07/09/2023, 06:31 AM

FB (Facebook Inc (NASDAQ:FB) recently roared above the $80 level to mark a new all time intraday trading high of $86.07.

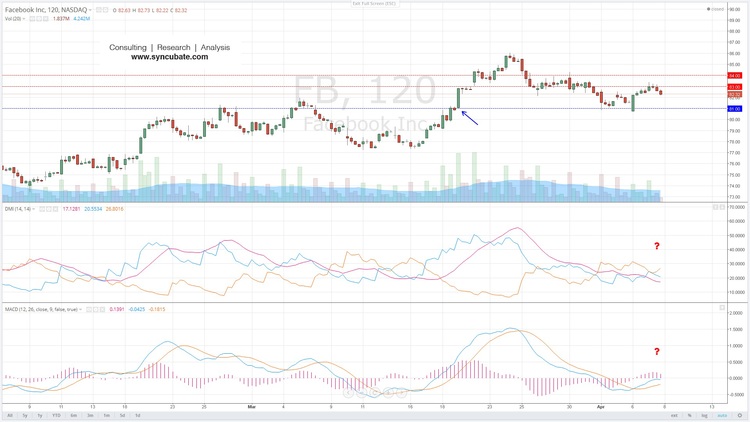
Facebook Inc 2 Hour Chart

In looking at the two hour chart we can see that the bulls really picked up the pressure as soon as the stock broke above $81 in mid-March, as noted by the blue arrow. Historically, this had been a tough level for the bulls to maintain the price above.

The momentum push higher was confirmed on the hold and subsequent rise above $82. By late morning on 3/24/15, Facebook traded just above $86. From this point forward, the decline in +DMI and crossover of the MACD line below the signal line indicated exhaustion on the part of the bulls.

We can see that Facebook has since pulled back to digest the latest gains, closing at $82.32 on 4/7/15. The ADX line is not rising, so there is no trending move in play at this moment over the two hour time frame. However, it is clear that +DMI and -DMI are taking turns in overlapping, so the bulls and bears are in the midst of a tug of war to determine who will move the stock in a big way next.

The $83 and $84 levels seem to be resistance for the bulls to overcome in the near term, with support at the breakout level around $81. If the MACD line crosses above zero and can hold above the signal line, a bullish continuation move may be in play. This would be further reinforced by a rising ADX line and spike in +DMI.

Latest comments

Risk Disclosure: Trading in financial instruments and/or cryptocurrencies involves high risks including the risk of losing some, or all, of your investment amount, and may not be suitable for all investors. Prices of cryptocurrencies are extremely volatile and may be affected by external factors such as financial, regulatory or political events. Trading on margin increases the financial risks.
Before deciding to trade in financial instrument or cryptocurrencies you should be fully informed of the risks and costs associated with trading the financial markets, carefully consider your investment objectives, level of experience, and risk appetite, and seek professional advice where needed.
Fusion Media would like to remind you that the data contained in this website is not necessarily real-time nor accurate. The data and prices on the website are not necessarily provided by any market or exchange, but may be provided by market makers, and so prices may not be accurate and may differ from the actual price at any given market, meaning prices are indicative and not appropriate for trading purposes. Fusion Media and any provider of the data contained in this website will not accept liability for any loss or damage as a result of your trading, or your reliance on the information contained within this website.
It is prohibited to use, store, reproduce, display, modify, transmit or distribute the data contained in this website without the explicit prior written permission of Fusion Media and/or the data provider. All intellectual property rights are reserved by the providers and/or the exchange providing the data contained in this website.
Fusion Media may be compensated by the advertisers that appear on the website, based on your interaction with the advertisements or advertisers.
© 2007-2024 - Fusion Media Limited. All Rights Reserved.