- Equities advance on reports China to increase U.S. imports
- Oddly, small caps still outperform NASDAQ
- Oil jumps toward $54 on risk and production cuts
- USD, yields move higher
- Martin Luther King Jr. Holiday; U.S. Markets Closed
- U.K. Prime Minister Theresa May must outline new Brexit plan today
U.S. equities advanced Friday, boosted by a number of fundamental drivers: reports surfaced that China promised to increase imports to end the trade dispute; positive corporate results for the nation’s major banks which reported at the end of the week as well as continued positive guidance from each financial institution, bolstering General Motors' (NYSE:GM) earlier strong forecast, which appears to have broken last quarter's softer guidance trend. The confluence of upbeat tailwinds helped stocks lock in a fourth straight week of gains.
S&P 500 Gains for Fourth Day, Fourth Week
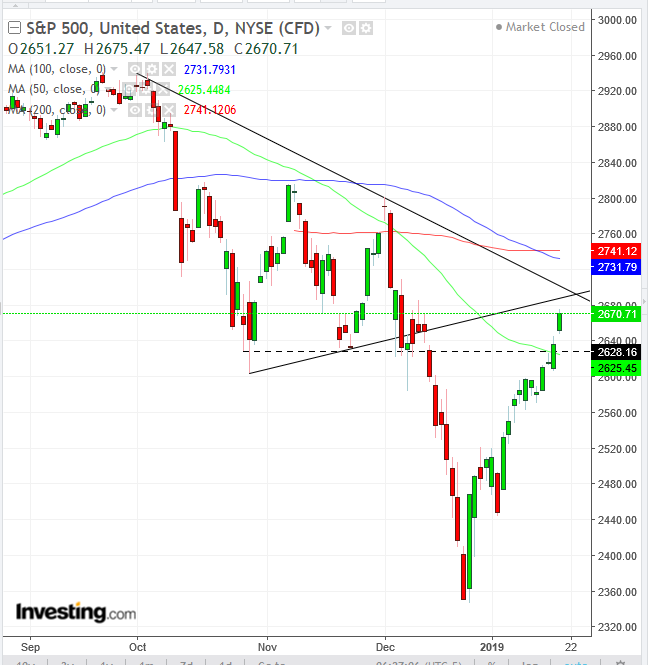
The S&P 500 rose on Friday, +1.32%, to cap a fourth straight day of increases—with every sector in the green—for a total uptick of 3.41% for the week. Energy shares (+2.03%) outperformed, tracking oil prices, which jumped on the outlook for a potential resolution to the trade dispute and the OPEC-led plan to cut production.
Industrials (+1.9%) followed closely behind, on the expectation of continued growth for multinational corporations, should global trade return to normal. Similarly, Materials jumped, (+1.65%). Financials advanced (+1.72%) after Goldman Sachs (NYSE:GS), Bank of America (NYSE:BAC) and U.S. Bancorp (NYSE:U.S.B) all beat expectations on both EPS and revenue. Utilities 'underperformed' (+0.11%) as risk-on appetite returned to markets.
From a weekly perspective, the SPX advanced 2.87%, buoyed higher for a fourth straight week, the longest stretch since August 2018, for a combined advance of 10.51%. Utilities were the only sector in the red for the week (-0.17%). Financials was the obvious sector outperformer (+6.12%), rising more than double the runner-up, Energy (+2.95%).

Technically speaking, the S&P 500 has rebound from its pre-Christmas rout. The index is coming up against the downtrend line from its September record high, and the bottom of the consolidation that followed it. While the consensus among technical analysts was that the 2600 level would be the key area for determining whether the post-Christmas rally was a correction within a downtrend or a new uptrend, we've insisted on the 2,700 level. That's where the downtrend, the prior consolidation and the 100 DMA and 200 DMA meet.
From a fundamental perspective, we've repeatedly said that a resolution to the trade dispute, a more dovish Fed and a weaker dollar just might give equities the boost required to return to an uptrend. However, for now, we’ll be watching whether the mentioned technical levels will hold or be breached, which would provide an indication of the trend.
The Dow Jones Industrial Average outperformed, jumping 1.38%, paralleling the industrials sector. While the U.S. Treasury denied the report that Secretary Mnuchin was a proponent of easing tariffs, reports on China’s offer to go on a $1 trillion shopping spree in the U.S. sent traders to a shopping spree of their own, as they bid up stocks.
The NASDAQ Composite gained 1.03% and the small cap Russell 2000 advanced 1.22%. We have written extensively about our surprise that small caps have outperformed throughout the U.S.-Sino talks. While not in the lead Friday, they have still outperformed the NASDAQ Composite, which seems to have fallen out of sync as the trade resolution proxy trade.

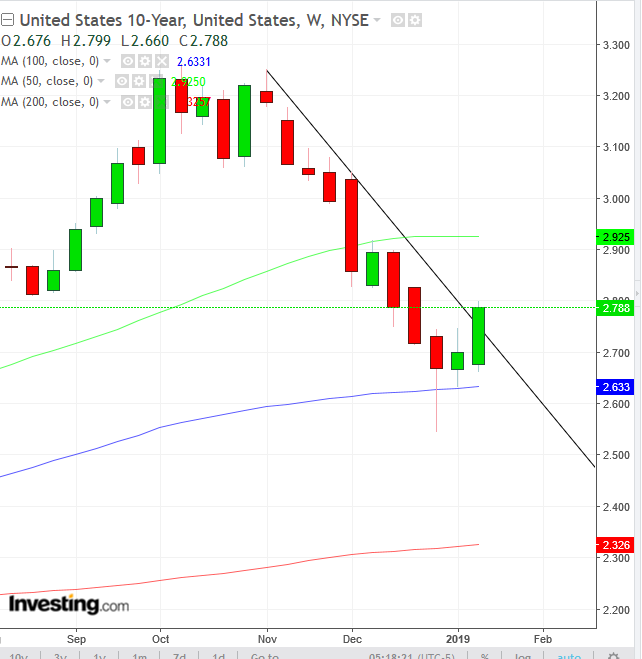
The yield on US 10-year Treasury notes crossed above the downtrend line since November, when they reached 3.250%, the highest since May 2011, as investors rotated out of safety into risk.

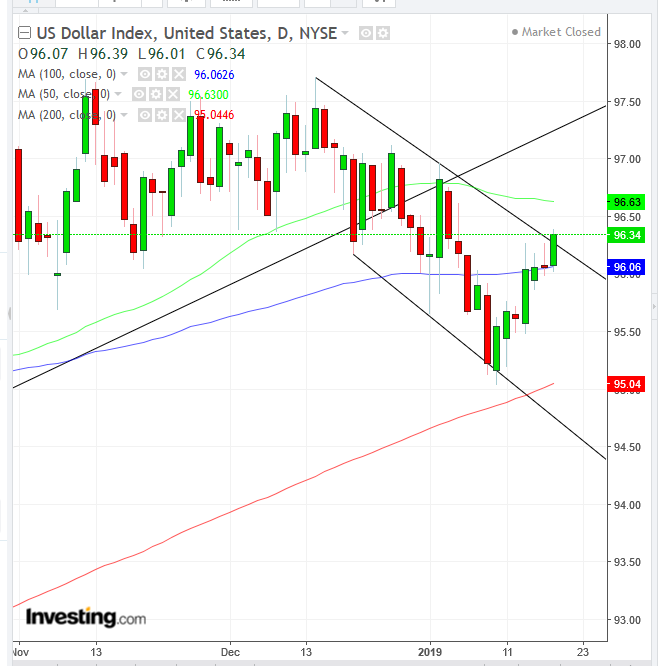
In tandem with yields, the dollar jumped versus both major currencies and gold. The Canadian dollar, however, as the notable exception, as rising oil prices increased demand for the loonie. Technically, the DXY crossed back above the 100 DMA but was stopped by the resistance line of its short-term falling channel. After the global reserve currency topped out, the onus is on bulls to push prices back above the violated uptrend line since April.

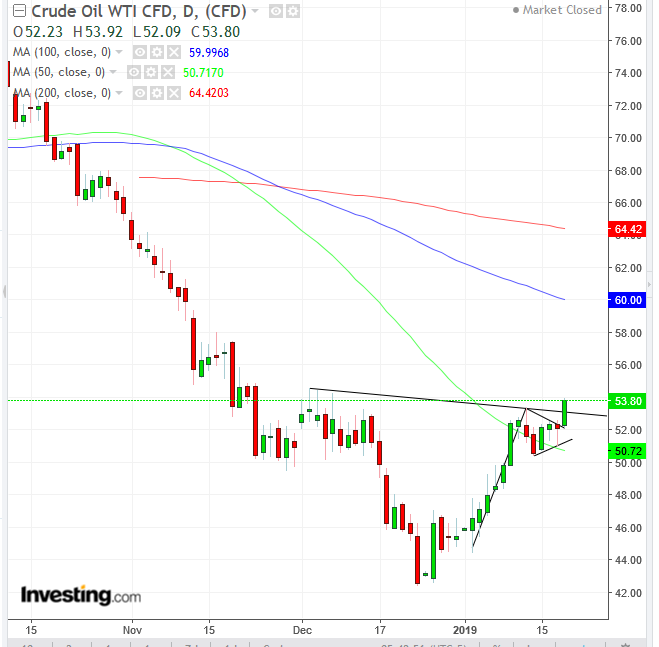
Oil completed a bullish flag as well as a potential H&S bottom. Be wary of a possible violent pullback as traders on both sides tend to come out of the woodwork at such technical junctures.
The Week Ahead
All times listed are EST
Sunday
21:00: China – GDP (Q4): growth forecast to be 6.4% from 6.5% YoY and 1.5% from 1.6% QoQ.
Monday
Tuesday
4:30: U.K. – Employment Data: December claimant count to decline to 20,100, from 21,900 a month earlier, while the November unemployment rate to hold steady at 4.1%; average earnings for November to hold at 3.3% (including bonus).
5:00: Germany – ZEW Index (January): economic sentiment index to fall to -18.8 from -17.5.
10:00: U.S. – Existing Home Sales (December): expected to contract to -0.1% MoM from a 1.9% gain in November.
18:50: Japan – Trade Balance (December): forecast to see the deficit narrow to Y300 billion from Y738 billion.
22:00: Japan – (Tentative) Bank of Japan Rate Decision: no change in policy expected.
Wednesday
10:00: Eurozone – Consumer Confidence (January, flash reading): expected to continue falling to -6.5 from -6.2.
Thursday
3:30: Germany – Manufacturing and Services PMI (January, flash): manufacturing PMI to rise to 51.6 from 51.5, while services to rise to 52.2 from 51.8.
7:45: Eurozone – ECB Rate Decision: no change in policy expected, but given the weakness in eurozone data of late, investors should watch out for the views of the bank on growth and inflation. Markets to watch: eurozone indices, EUR crosses
9:45: U.S. – Manufacturing PMI: to fall to 53.4 from 53.8, and services to fall to 54.2 from 54.4. Markets to watch: U.S. indices, USD crosses
11:00: U.S. – EIA Crude Inventories (w/e 18 January): stockpiles to rise by 7.5 million barrels
Friday
4:00: Germany – Ifo Business Climate Index (January): expected to rise to 100.7 from 101
